Unleashing Clean Energy in the U.S.: Strategy Report
Summary
What is Giving Green’s vision for unleashing clean energy in the U.S.?
The U.S. is currently entering an era of growing electricity demand, energy shortages, and reliability risks. To successfully decarbonize electricity in the U.S. and bring about lasting change, decarbonization strategies must focus on meeting energy demand with clean, reliable, and cheap energy without compromise.
To meet this vision, we highlight two initial pillars of work that require philanthropic support: (1) commercializing and deploying clean firm power and (2) addressing barriers to clean energy deployment. These pillars address the key challenges of rapidly scaling clean, reliable energy to meet growing energy demand.
What is clean firm power, and why is it important?
Clean firm power refers to technologies that can produce electricity on demand and over long periods of time without emitting greenhouse gases. Examples include geothermal, nuclear fission, hydropower, and long-duration energy storage.
Many new and advanced clean firm technologies, which have the potential to drive the mass deployment of clean firm power, are still in early stages of development and share similar challenges. These technologies, however, are crucial to successfully creating a zero-emission grid that does not rely on a costly and unrealistic overbuild of renewable energy resources and grid infrastructure. Unfortunately, many existing philanthropic efforts have been siloed into specific clean firm technologies rather than building solutions that tackle shared challenges across clean firm technologies.
To take advantage of current bipartisan support for innovative clean firm technologies and advance clean firm power as a whole, philanthropic efforts must incorporate solutions to shared challenges and, in turn, support the progression of a variety of clean firm technologies.
What do our findings indicate to be the most promising philanthropic pathways for supporting clean firm power?
At a high level, we identified several challenges hindering the deployment of various clean firm technologies. While all of these are important, we prioritized four challenge areas and subsequently four different clean firm philanthropic strategies based on their scale and feasibility:
- Opening new sources of financing
- Advocating for market and grid regulatory reform
- Building demand support
- Supporting RD&D and innovation for clean firm technologies
What are barriers to clean energy deployment, and why are they important?
Many challenges hinder the deployment of clean energy, but we found three major barriers that could prevent clean energy from being deployed:
- Project delays and cancellations due to federal permitting
- Local permitting and siting restrictions that prevent the deployment of clean energy
- Long wait times and a challenging process to interconnect a clean energy project onto the grid
If these barriers are not addressed, meeting future electricity demand while reducing emissions will be challenging.
What do our findings indicate to be the most promising philanthropic pathways for addressing barriers to deployment?
A majority of the challenges experienced across the three barriers to clean energy deployment are related to policies. As a result, the most promising way for philanthropy to address these barriers is to support the research and development of new policies and educate policymakers on the risks of harmful policy practices. Additionally, as of 2025, this philanthropic pathway can leverage several windows for policy progress, fueled by bipartisan support for removing barriers to constructing infrastructure.
What are the key uncertainties and open questions?
Our key uncertainties relate to the ability of specific clean firm technologies to mature and reduce in cost quickly, and to the political environment that could shape the likelihood of policy solutions and introduce additional barriers to clean energy deployment.
What is the bottom line, and what are the next steps?
Given the trend of increased electricity demand, the large source of emissions from the U.S. grid, and the potential technological and strategy spillover to other countries, we believe that decarbonizing and modernizing the U.S. grid must be a philanthropic priority. As a result, we recommend that philanthropists fund organizations working to address the challenges and barriers outlined in this report and consider grants aligned with the strategies we have laid out.
The findings in this report will inform the grantmaking strategy for the Giving Green Fund and our list of Top Climate Nonprofits. We plan to continue exploring other potential major challenges to the U.S. clean energy transition that are not yet covered in this report. Therefore, donors interested in advancing this work can donate directly to the Giving Green Fund.
This report was last updated in March 2026.
This is a non-partisan analysis (study or research) and is provided for educational purposes.
Questions and comments are welcome at hello@givinggreen.earth.
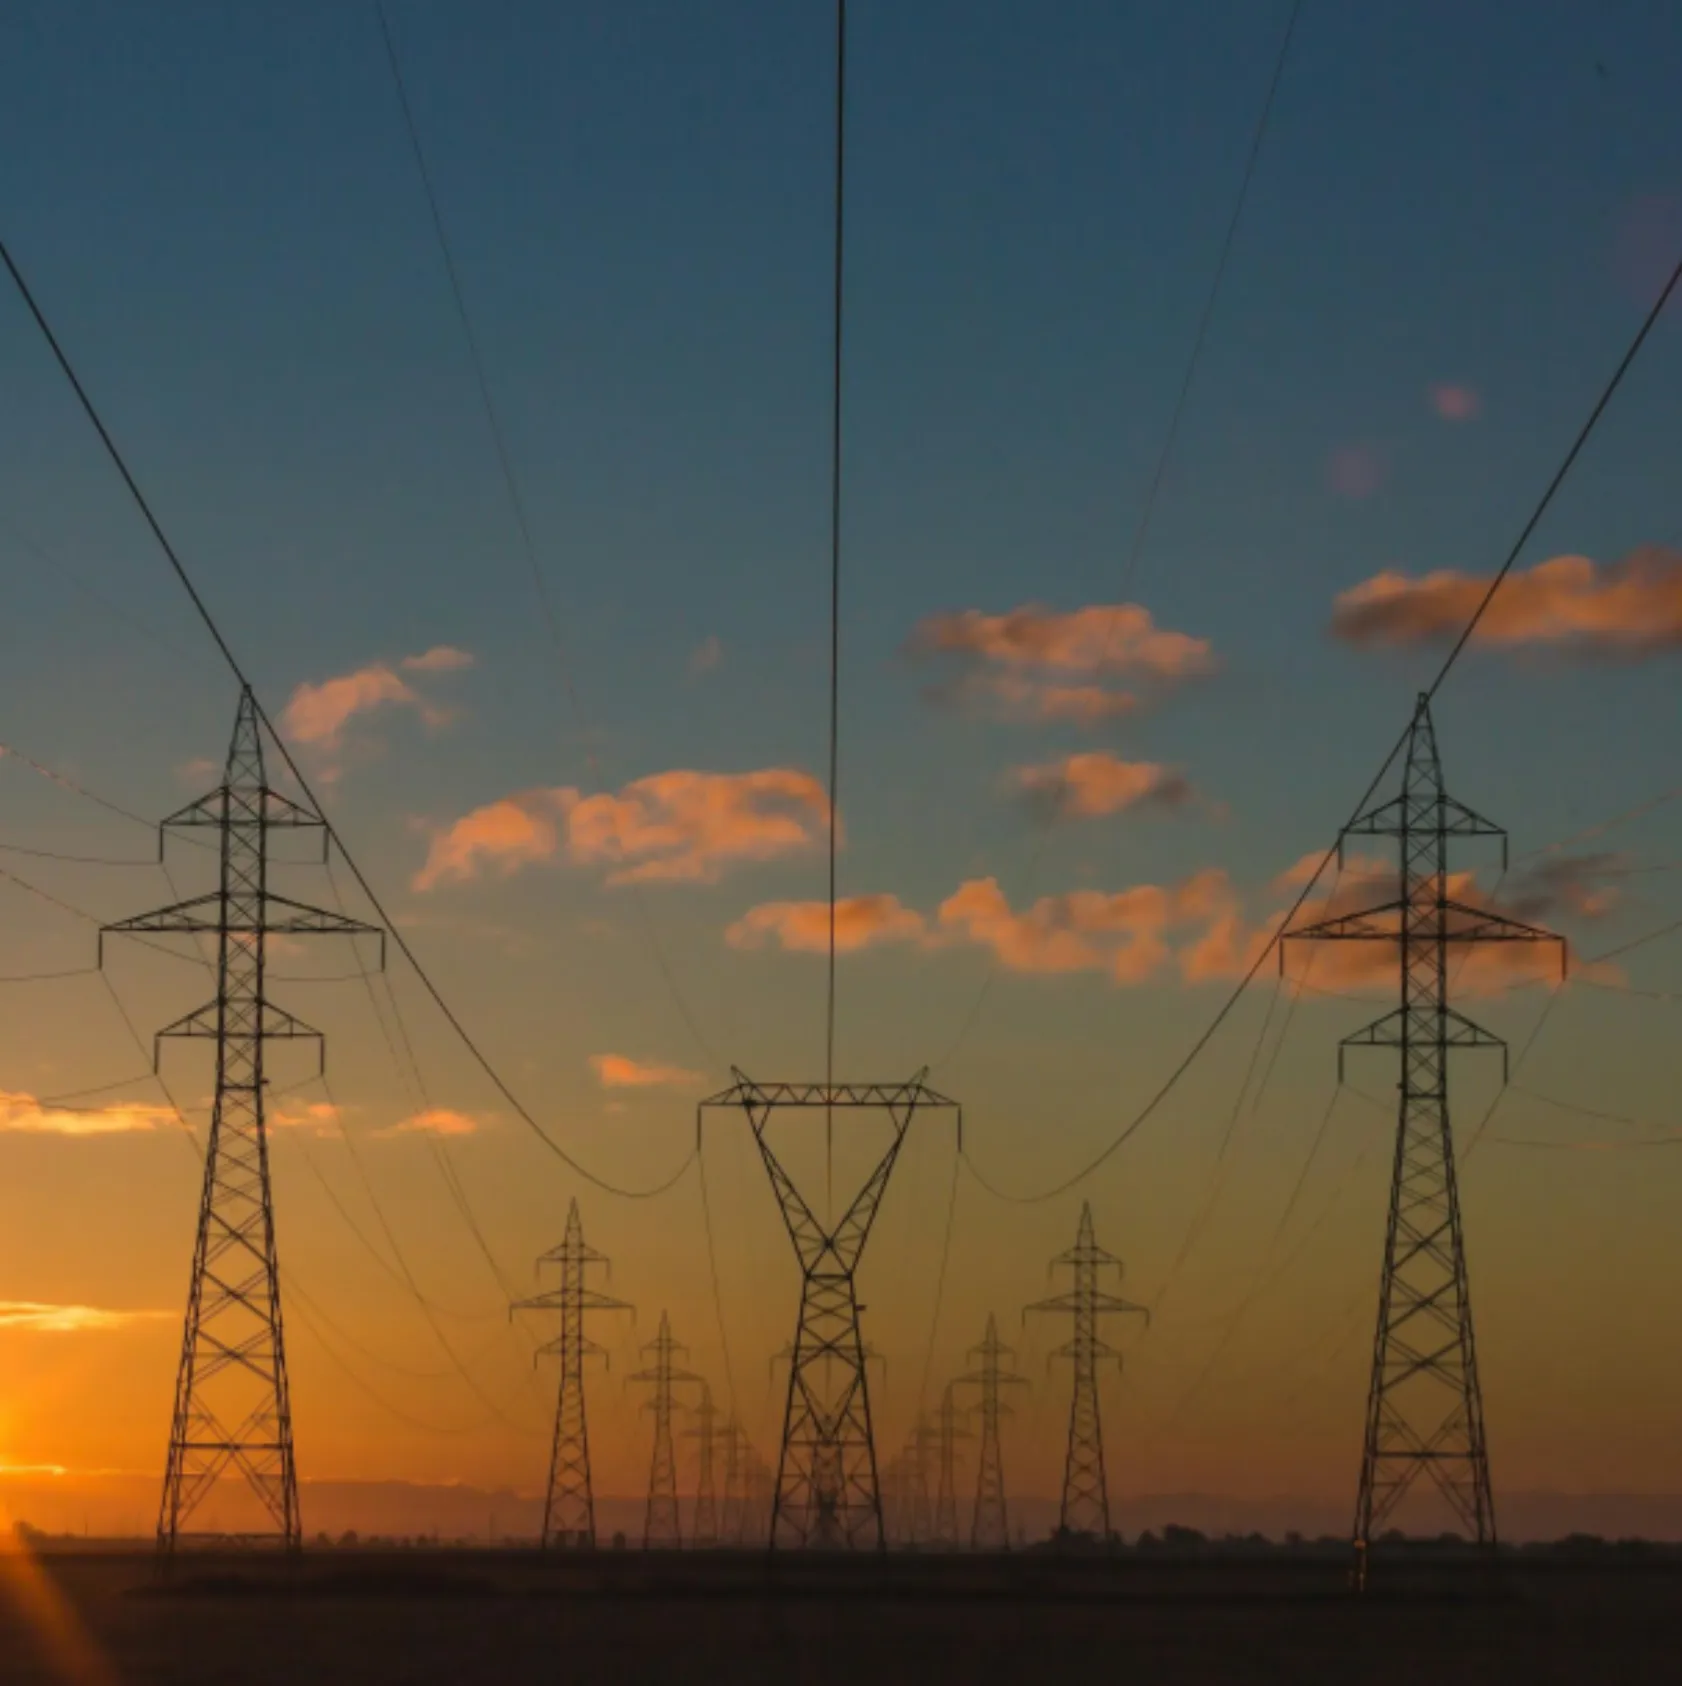
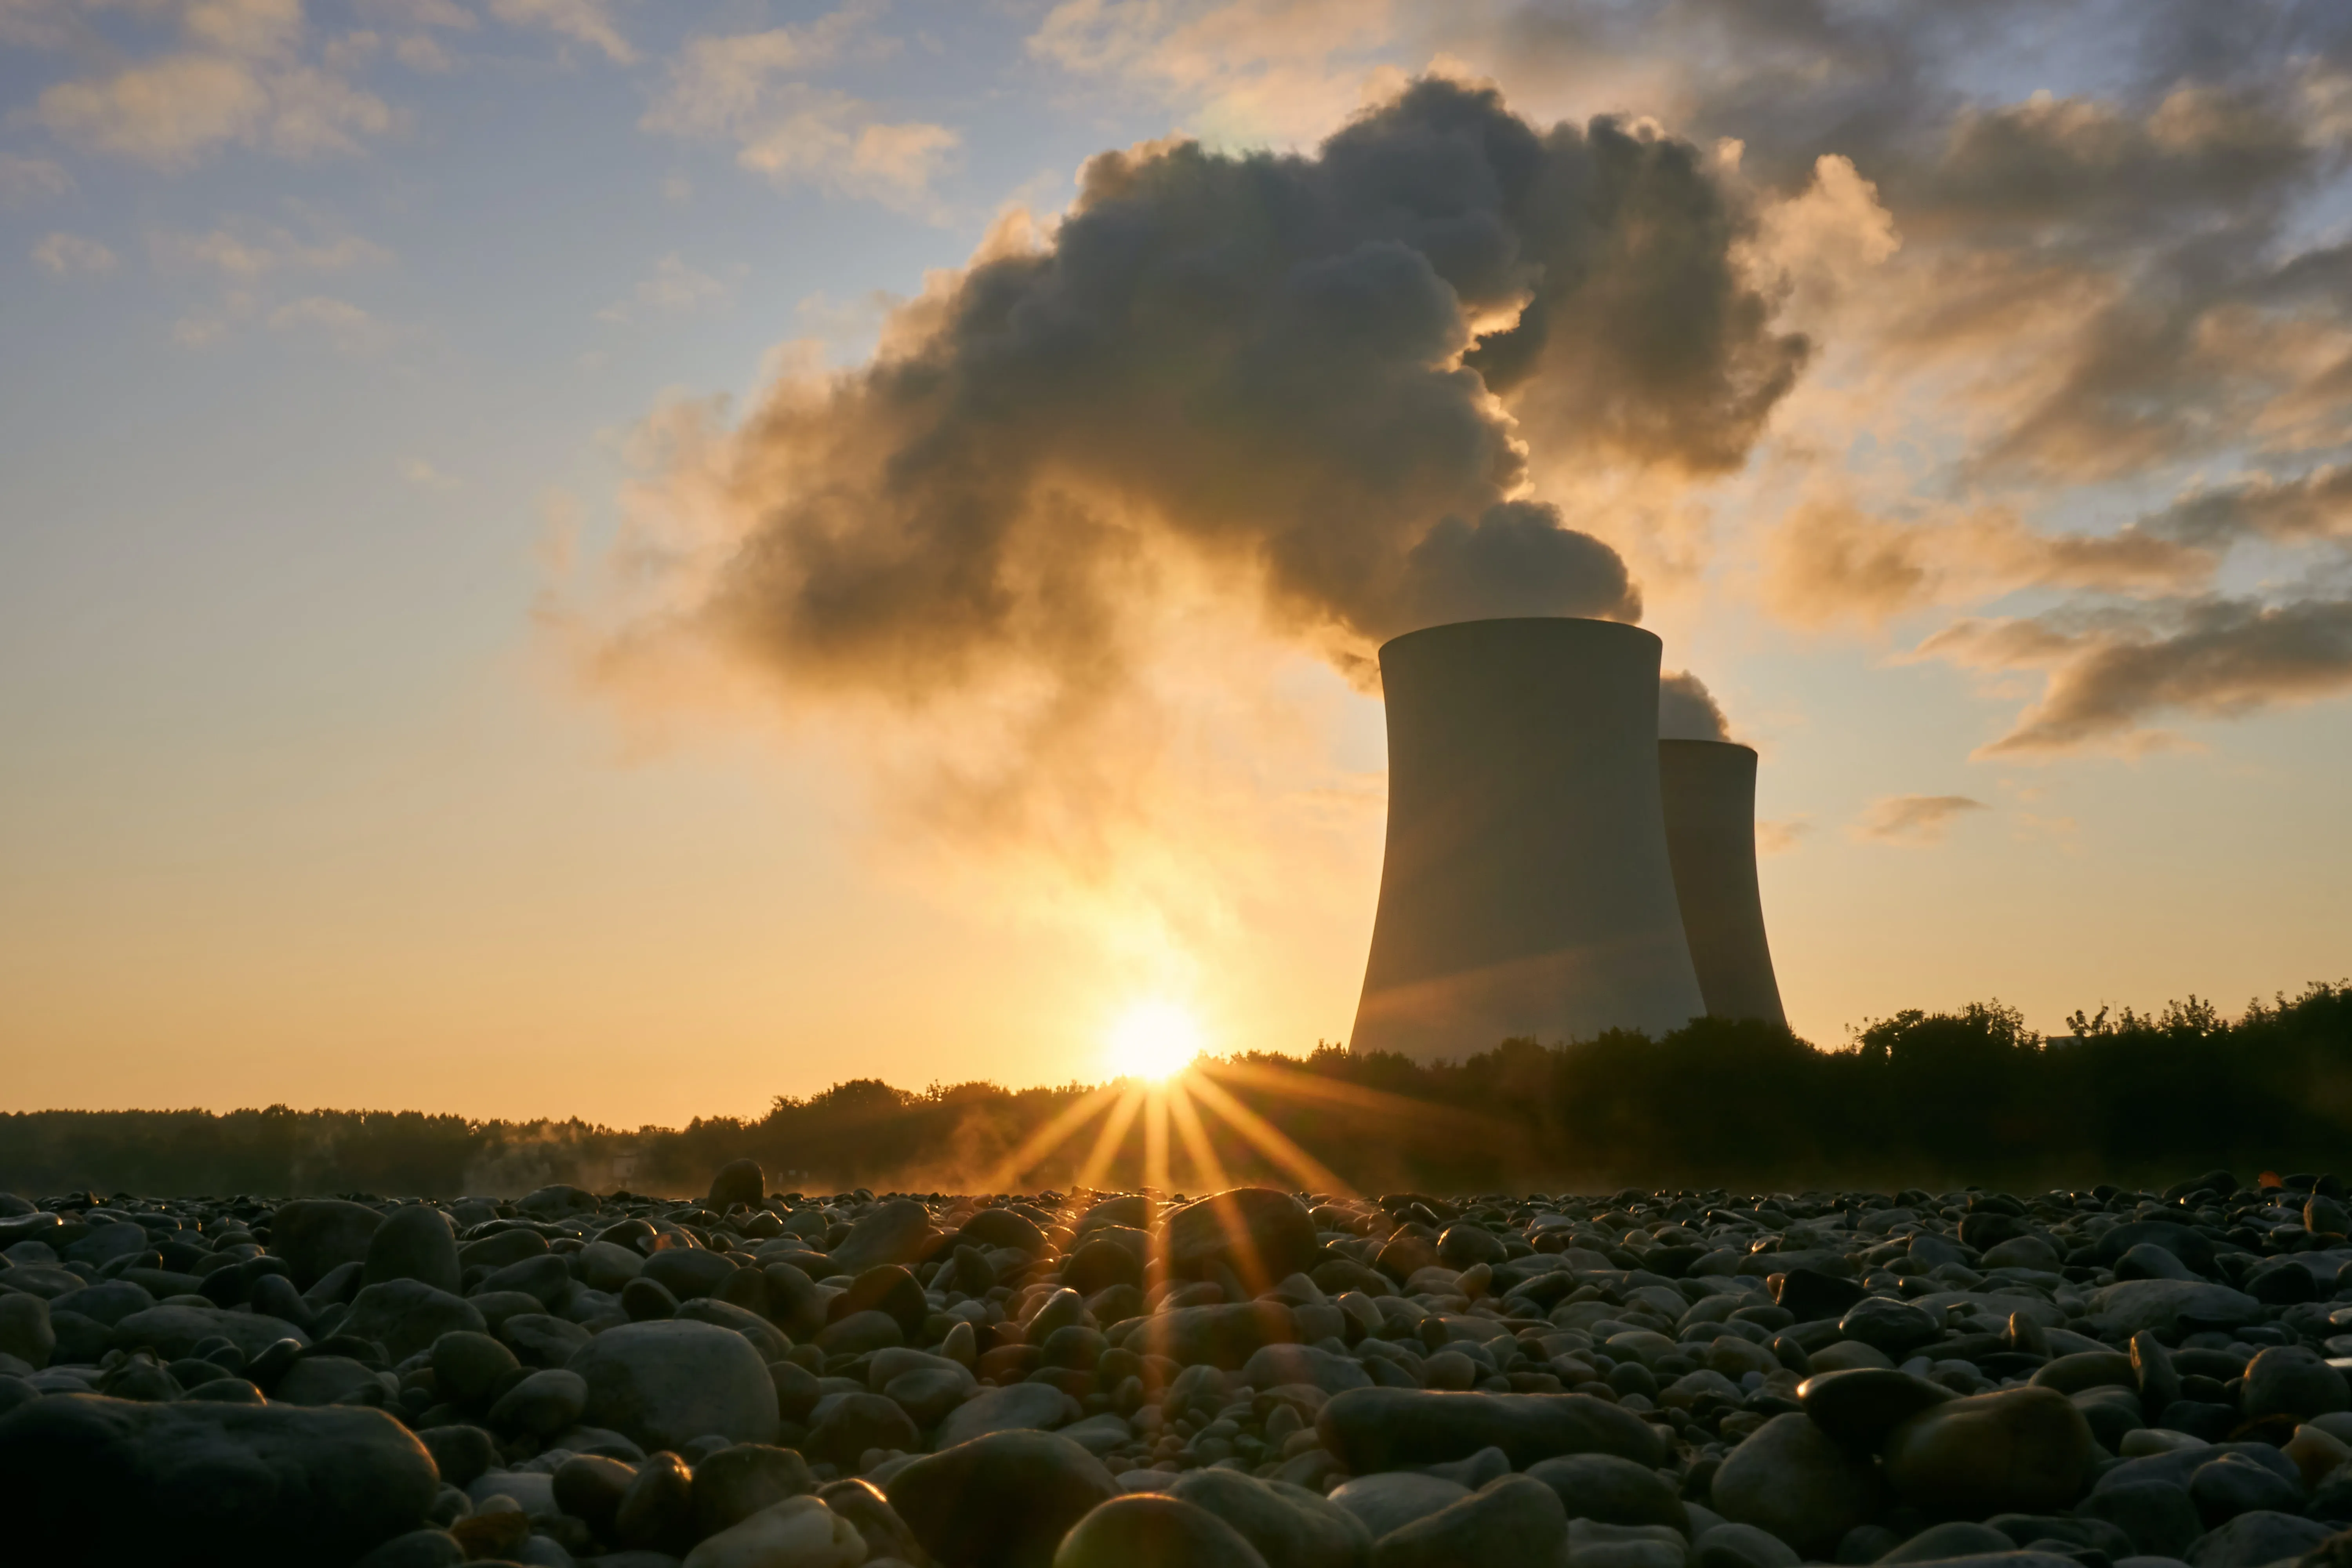
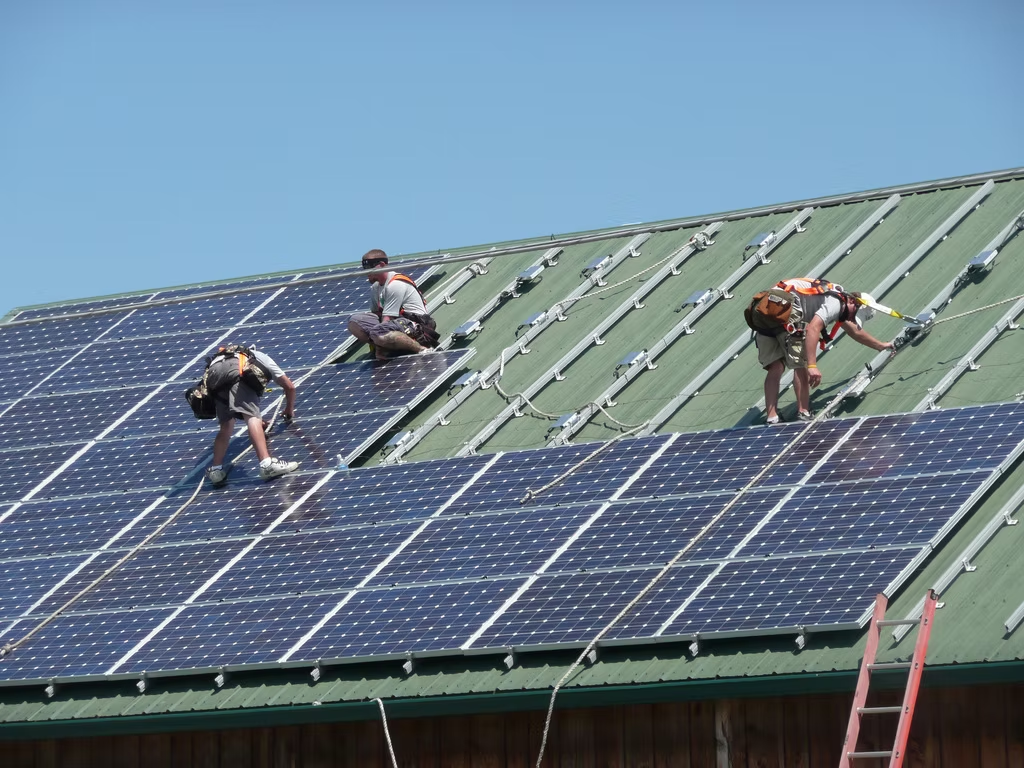
Cover image: Matthew Henry, Unsplash
Preamble
The Unleashing Clean Energy in the U.S. report was written in Summer 2025, as the 119th U.S. Congress and the Trump Administration passed the One Big Beautiful Bill Act (OBBBA), which rescinded or altered many of the climate incentives enacted by the Inflation Reduction Act (IRA). The climate advocacy path for many in philanthropy is unclear, and the vision of a zero-emission electricity grid seems like a hope of the past. In this report, we lay out the major challenges to realizing a zero-emission grid and how philanthropy can make meaningful progress under the current and future administrations toward removing these barriers and building a clean, cheap, and reliable U.S. grid.
Introduction
Key ideas: Giving Green’s vision for unleashing clean energy in the U.S.
1. Rising demand: The current grid capacity must nearly double by 2050, largely due to electrification and energy-hungry data centers. To meet this demand, we need rapid deployment of clean energy.
2. Reliability at risk: Extreme weather, data center loads, and aging infrastructure threaten grid stability, making reliability and resilience as important as decarbonization.
3. Giving Green’s clean energy vision: We envision an evolution of the U.S. grid toward zero-emission electricity that can (1) reliably meet the needs of the country in the face of growing threats, and (2) provide cheap energy to meet the growing demands of the 21st century without compromise.
4. U.S. leverage: We focus on the U.S. because it is the world’s second-largest emitter and is a hub for technology innovation. We think U.S. progress can drive both domestic and global decarbonization.
5. Our philanthropic focus: We recommend that donors prioritize scaling clean firm power (such as nuclear and geothermal energy) and removing deployment barriers to renewable energy (such as solar and wind).
The Path to Cheap, Clean, and Abundant Energy
Decarbonization requires the electric grid to rapidly move to carbon-free generation while transitioning other energy sources to electricity. As a result, many philanthropic strategies have focused on bringing U.S. grid emissions to zero or net-zero. Giving Green believes this is essential, but only part of the equation to securing emission reductions.
The ongoing geopolitical challenges and ever-evolving political dynamics of this decade have proven that we must build toward a more comprehensive vision beyond emissions reductions to deliver successful, long-lasting climate interventions. Decarbonization strategies should not have to compete with other priorities, and instead, they should focus on modernizing the U.S. grid to incorporate various country priorities.
As a result, we envision an evolution of the U.S. grid toward zero-emission electricity that can (1) reliably meet the needs of the country in the face of growing threats, and (2) provide cheap energy to meet the demands of the 21st century without compromise.
To reach this outcome, clean energy sources will need to:
- Outcompete existing greenhouse gas-emitting generators as well as any new generators that may be proposed, all while ensuring that the cost of clean electricity is low enough to spur economic growth.
- Be deployed at a rate fast enough to meet growing electricity demand driven by a wave of new data centers and the electrification of different technologies, without presenting itself as a roadblock to these industries.
- Emphasize resilience and reliability to ensure the grid’s evolution toward decarbonization never becomes a hindrance.
By working toward this vision, we believe that any decarbonization progress will be less likely to be at the mercy of partisan retaliation and more likely to endure.
Why U.S. Climate Action Matters
In 2023, U.S. greenhouse gas (GHG) emissions were roughly 5.89 billion tons of CO2e, or 11% of global emissions, making it the second largest global GHG emitter.1 While significant, U.S. emissions have been slowly declining, down 16% since 2007. Despite this existing downward trend, we believe that focusing philanthropic efforts on the U.S. could lead to additional in-country reductions and global emissions reductions, given the country’s central role in decarbonization and its political motivation to drive energy security.
Exporting Innovation to Advance Climate Goals
Historically, the U.S. has been the hub of technology innovation, and while it is no longer the sole leader, it still excels in innovation. It is well-positioned to make many breakthroughs that could be shared with other countries. Additionally, new policies and grid-operating strategies tested in the U.S. could be similarly disseminated worldwide. While there have been policy setbacks, the U.S. still has the right environment to make progress and remain a global leader in decarbonization, especially in an age when geopolitical conflicts have divided global partnerships
Navigating Grid Decarbonization in a Divided Political Era
Under the Trump administration, climate change has once again become politically divisive, meaning some tactics of the past are no longer adequate. While this will slow climate efforts, there are still opportunities through other bipartisan policy priorities that can drive the decarbonization of the U.S. grid.
For example, due to growing geopolitical tensions, U.S. energy dominance and energy security are becoming bipartisan priorities at the federal level. While these may mean different things to each political party, there are still commonalities between what each side of the aisle would like to accomplish, including removing barriers to construction, increasing low-cost domestic energy, and reviving U.S. industrial sectors. Across these priorities, there is potential to make progress on grid decarbonization—whether under the Trump administration or future administrations—by passing legislation that is not explicitly pro-climate.
Beyond the federal level, significant progress in grid decarbonization can be made at the regional, state, and local levels now and in the future.
Together, we believe that while the change in the U.S. political environment has caused setbacks in domestic climate efforts, there are several areas where philanthropy can drive decarbonization on the grid.
Understanding the U.S. Power Grid
Bridging the Clean Energy Supply-Demand Gap
Over the last decade, consistent electricity demand created the conditions for replacing aging or uncompetitive GHG-emitting generators with cleaner energy sources, thereby driving progress in U.S. electricity decarbonization.2 However, demand is not expected to stay stagnant. Since 2020, electricity consumption has risen and is expected to continue to grow at “an average rate of 1.7% per year” by 2026.
Increased electricity demand is not expected to be a short-term phenomenon. By 2050, total electricity demand is expected to go from around 4,000 TWh in 2024 to roughly 7,000 TWh, with peak demand also increasing from 800 GW to around 1,200 GW.3 Over the next 10 years, a large share of this growth will be driven by data centers, adding 200 to 250 TWh of electricity consumption. In the long term, however, demand growth will additionally be driven by the continued electrification of the transportation, industrial, and commercial sectors. To meet this increased demand, installed grid capacity will have to reach between 2,500 GW and 3,000 GW, nearly double the current grid capacity (Figure 1).4

To decarbonize its grid, the U.S. must continue replacing existing capacity while simultaneously doubling total capacity by adding new clean generation. While extremely challenging on its own, doing so becomes even more complicated when considering that artificial intelligence (AI) data centers—a major source of future demand—will require consistent power 24/7 to ensure uninterrupted operations.6 To meet this demand, data centers cannot solely rely on variable renewable energy (VRE), such as solar and wind. Instead, these projects will need to rely on VRE plus energy storage, natural gas, nuclear, geothermal, and other firm power sources to ensure reliability.7
Unfortunately, the U.S. is not integrating new clean energy resources quickly enough to both meet such a rapid spike in demand and replace retiring generators.8 The same goes, however, for firm energy resources such as natural gas turbines, which are facing supply chain constraints and leading to new projects being pushed back to 2028 and beyond.9 This mismatch in supply and demand, especially from data centers, is already starting to increase electricity prices and seems likely to worsen in the coming years as electricity prices adjust to the recent supply challenges. Simultaneously, electricity is becoming more expensive due to the upgrades necessary to maintain an aging grid and investments required to repair and prevent additional grid damage from the increase in natural disasters.10 All together, increased electricity prices have the potential to slow economic growth in the U.S. and hinder the decarbonization of new and existing industries.
Ensuring a Stable Grid as Clean Energy Scales
To decarbonize the grid, the U.S. must focus on meeting demand with clean energy resources. At the same time, it is similarly crucial to consider how grid reliability will change as the U.S. shifts toward a larger buildout of clean energy. In this context, grid reliability refers to three characteristics: resource adequacy, operational reliability, and resilience (Figure 2).11

Some reliability challenges the grid faces today include severe outages caused by extreme weather events (resilience), compromised grid stability due to the unique and rapid power usage of data centers (resource adequacy), and the quick reduction of power output from inverter-based resources (IBRs) (e.g., solar and wind) following a disturbance, such as a large generator going offline, which worsens the grid’s stability even further (operational reliability).13 Such generation-related challenges, along with a host of additional challenges such as inadequate and aging transmission and distribution infrastructure, have led the American Society of Civil Engineers to give the U.S. grid a D+ rating.14 As the U.S. continues to build out clean energy, current and future reliability challenges must be addressed to both meet the needs of the future and ensure the U.S. can continue decarbonizing its grid.15
The Pillars to Unleashing Clean Energy in the U.S.
To successfully spur the modernization of the U.S. grid and unleash clean, cheap, and reliable electricity, philanthropy should focus on impactful strategies that address the growing supply and demand imbalance and grid reliability challenges.
In the following sections, we cover the two initial pillars we view as necessary to securing this vision: (1) commercializing and deploying clean firm technologies and (2) addressing clean energy deployment barriers. We prioritized these pillars based on our research prioritization dashboard, in which we compared various impact areas based on scale, feasibility, and funding need.16
We acknowledge that this is not a complete list and that there are other potential pillars we would like to explore further, such as innovation policy and advanced transmission technologies.
-----
1Jones et al. (2024) – with major processing by Our World in Data
2U.S. Energy Information Administration (EIA), 2025
3While total electricity consumption in 2050 is projected to be around 7,000 TWh, net consumption in 2050 could be closer to 5,672 TWh when considering gains in efficiency. This is still a 69% increase in consumed electricity compared to the net electricity consumption in 2024. NEMA, 2025;ICF, 2025
5ibid.
6“Data centers can impact regional grids given the steep increases in load size, may be geographically constrained due to latency requirements, and often require firm power sources to operate continuously.” U.S. Department of Energy (DOE), n.d.
7While data centers can be powered by a combination of battery energy storage systems (BESS) and VRE, they will still require additional firm resources to ensure they receive 24/7 power. If BESS were overbuilt, it may be able to provide 24/7 with VRE, but this may present price competitiveness and land resources challenges.
8In 2024 44.7 GW of solar and wind capacity was added to the grid. This is a record high but it still is not fast enough. U.S. net electricity demand is expected to rise by 423 TWh between 2024 and 2030. If the U.S. were to deploy solar and wind at the same 2024 rate every single year then it could meet demand needs in 2030 (This is assuming both the solar and wind operate a capacity factor of 20%, and does not consider the energy storage that would need to be deployed to be able to shift such high level of demand). Maintaining the 2024 rate of deployment, however, is not feasible ever since the passage of OBBBA. Additionally, this does not take into account replacing 40GW of baseload capacity expected to retire between now and 2030. Deployment data: WRI, 2025; demand data: NEMA, 2025; Post OBBBA projected deployment rates: BloombergNEF, 2025; Retirement data: ICF, 2025 (p.9)
9“Three companies will need to supply most of the historic demand for new gas plants: GE Vernova, Siemens Energy, and Mitsubishi Power — who together serve over 75 percent of projects under construction. Booming demand for turbines has led each of these companies to report extended delivery timelines. Mitsubishi states that turbines ordered today will not be delivered until 2028–2030. Siemens reports a record backlog of €131 billion (US$148 billion). And GE Vernova has announced new turbines will not be available until late 2028 at the earliest.” RMI, 2025
10“Data centers added $9.4 billion in costs last year, according to an independent market monitor.” Heatmap, 2025
11Resource Adequacy (RA) - the ability for the grid to maintain electricity supply to meet demand during expected or unexpected outages; Operational Reliability - the ability for the grid to maintain level power and avoid equipment damage during a disturbance, such as a power plant or transmission line failing; Resilience - similar to RA, but refers to the grid’s ability to withstand and recover from extreme events. NREL, 2024
13North American Electric Reliability Corporation, 2025
14American Society of Civil Engineers, 2025
15It is important to consider potential new reliability challenges that may be caused as we deploy more clean energy resources. For example, as fossil fuel generators are increasingly retired and replaced with IBRs, the grid's inertia will lower, meaning it could be harder to respond to a drop in frequency caused by a grid disturbance. IBRs do have the ability to immediately react to a drop in frequency and stabilize it, but it is uncertain whether they could completely replace the traditional grid inertia provided by fossil fuel generators. Potential challenges like this require additional work to better understand how the grid of the future will function and what needs to be done to ensure it is reliable. Energy Innovation, 2025
16We selected clean firm on the basis of our previous assessment of next-gen geothermal and nuclear power. We have combined them in this report due to their shared challenges and because we see broader opportunities that can support clean firm power as a whole.
Commercializing and Deploying Clean Firm Power
What is Clean Firm Power, and Why Do We Need It?
Key ideas: Supporting grid decarbonization with clean firm power
Complement to renewables: Clean firm power refers to carbon-free electricity generators that reliably and consistently produce power on demand (e.g., nuclear, geothermal). Clean firm power helps the grid run reliably, even during long periods of low power from variable renewable energy sources (VRE), such as solar and wind. Without clean firm power, the U.S. would need to overbuild VREs, storage, and transmission, leading to higher costs and land-use challenges. It is also unclear whether such an overbuild would be feasible due to grid-balancing requirements and transmission constraints. Net-zero models show that the U.S. must quadruple clean firm power (700-900 GW by 2050) to meet future demand
Philanthropy’s role: Philanthropy can de-risk early-stage clean firm technologies, push for markets to reward reliability, and help policymakers develop a stronger understanding of clean firm power’s critical role on the grid. Progress on clean firm power must significantly increase so that technologies are ready for large-scale deployment in the coming decades.
Clean firm power refers to carbon-free electricity generators that reliably and consistently produce baseload power on demand. Examples include nuclear fission and fusion; geothermal; long-duration energy storage (LDES); natural gas with carbon capture, utilization, and storage (CCUS); and hydropower. Each example has its distinct advantages and disadvantages (Figure 2).17 This class of electricity generators is crucial for providing baseload power that ensures the grid runs reliably, even during long periods of low power from variable renewable energy sources (VRE) such as solar and wind. We view clean firm power and VRE as complementary and think both are essential to building out a zero-emissions grid.

In general, an energy portfolio that includes clean firm power provides a more feasible pathway to net-zero emissions than one based solely on VRE. For example, the National Renewable Energy Laboratory (NREL) found that in least-cost scenarios for a 100% clean grid, solar and wind would provide 60–80% of electricity.19 In each scenario, clean firm power met the rest of the electricity demand, with each of the four core scenarios showing growth in nuclear, hydropower, and geothermal.20 A separate study found that adding at least one type of clean firm power can overcome reliability challenges and reduce electricity costs.21
Without clean firm technologies, the U.S. would have to overbuild VRE, storage, and transmission to the point where 35% to 50% of capacity would not be used unless there were an unusual and extreme period of high demand.22 In addition to being wasteful and costly, such overbuild may not even be feasible due to land requirements.23 Overall, several models suggest the U.S. must quadruple clean firm power—adding 700–900 GW by 2050—to support renewables and rising demand (Figure 4).24

We think philanthropy can play an important role in supporting both VRE and clean firm power. Indeed, our second pillar of addressing clean energy deployment barriers addresses both. However, we place a special focus on clean firm power for several reasons:
- Clean firm power lacks commercial momentum: Solar and wind are both mature technologies and have dramatically decreased in cost over the last fifteen years, making them commercially competitive in many markets.26 In comparison, clean firm power—especially more nascent forms of technology—is less mature, higher risk, and harder to finance. Philanthropy can help de-risk these newer technologies.
- Clean firm power would benefit from more market support: Clean firm power provides system-level reliability, dispatchability, and grid stability that are not yet well-compensated in current markets. Philanthropy (via policy advocacy) is well-positioned to ensure these attributes are recognized and rewarded.
- Clean firm power is needed for a functioning grid and needs work now: To meet climate targets and grid demand, the U.S. needs to start developing these technologies so that they can be deployed in the coming decades. Delaying this work could lead to missed decarbonization goals, supply chain issues, and higher costs in the future.27
- Clean firm power is not well understood by philanthropy, non-governmental organizations, and policymakers: There is room to educate these groups working toward decarbonizing and modernizing the U.S. grid about the role clean firm resources can play. Many existing efforts are siloed into single technologies and fail to support other clean firm technologies that could similarly provide the crucial services needed to decarbonize the U.S. grid.
Technologies of Focus
Giving Green believes that clean firm power deserves philanthropic support as a broad class of technologies. Many clean firm technologies—despite their differences—face similar challenges that prevent widespread grid integration, and these cross-cutting needs have been largely overlooked. Most philanthropic and nonprofit efforts have been siloed into individual technologies, missing opportunities for coordination and collective impact. We identify the shared challenges facing clean firm power (“Challenge Areas for Clean Firm Power”) and propose priorities for addressing them (“Prioritizing Philanthropic Levers to Commercialize and Deploy Clean Firm Power”).
Within this broader commitment, we currently give special attention to nuclear fission and next-generation geothermal, based on our assessment of their scale, feasibility, and funding needs. Both technologies have the potential to provide cost-competitive clean firm power and face similar commercialization hurdles. We also see meaningful political momentum behind them: there is strong bipartisan support for these technologies, and even as the current administration has stepped back from broader climate commitments, nuclear and geothermal have retained backing across party lines.28 U.S. Secretary of Energy Chris Wright, for example, has publicly supported both and helped preserve their tax incentives as other clean energy credits were cut.29 For more information on nuclear fission and next-gen geothermal, please see Appendices A and B. While we do not currently focus on other specific clean firm technologies, we may focus on them in the future. Appendix C explains our reasoning for deprioritizing them at this time.
Challenge Areas for Clean Firm Power
In an effort to shed light on areas where philanthropy can support various clean firm technologies, we introduce challenges that several clean firm technologies face. We describe these challenges and what philanthropy can do. We provide more detail on the challenges in the sections below.
Challenges and philanthropic opportunities to commercializing and deploying clean firm power:
- Sub-strategy: Opening new sources of financing
- Challenge: Clean firm technologies struggle to secure competitive financing due to first-of-a-kind risks, high upfront capital costs, and megaproject complexities.
- Philanthropy can: Enable risk-sharing tools and innovative finance structures to boost investor confidence
- Examples: Advocate for federal risk-tolerant financing; research and promote risk-sharing instruments (e.g., insurance products); develop and advocate for project finance and offtake innovations
- Sub-strategy: Advocating for market and grid regulatory reform
- Challenge: Current electricity markets, planning models, and cost metrics undervalue the reliability and long-duration services of clean firm technologies, creating structural barriers to their deployment.
- Philanthropy can: Support efforts to modernize market rules, modeling, and valuation methods
- Examples: Advocate for utilities, PUCs, RTOs, and ISOs to improve modeling practices; push for metrics that better capture clean firm power's value; advocate for power market reforms that support grid decarbonization.
- Sub-strategy: Building demand support
- Challenge: Without clear, long-term commitments from buyers and policymakers, manufacturers have little incentive to invest in the production capacity needed to scale these technologies.
- Philanthropy can: Advocate for policies that aggregate demand, reduce first-mover risks, and connect suppliers with buyers and investors globally.
- Examples: Advocate for demand aggregation policies; connect industry to global investors and buyers; build the case for international markets to justify manufacturing scale-up.
- Sub-strategy: Ensuring a robust and resilient supply chain and workforce
- Challenge: Some clean firm technology industries rely on a limited number of suppliers and a shortage of skilled labor.
- Philanthropy can: Build a more robust and resilient supply chain and workforce by researching vulnerabilities, advocating for protective policies, and supporting workforce attraction and training.
- Examples: Research supply chain vulnerabilities; advocate for supply chain risk policies; attract, educate, and retain a skilled workforce.
- Sub-strategy: Addressing permitting and siting challenges for clean firm power30
- Challenge: Lengthy, unpredictable permitting processes and limited regulatory capacity hinder deployment.
- Philanthropy can: Support advocacy around streamlining and harmonizing processes, strengthening regulatory capacity
- Examples: Advocate for expedited or harmonized permitting; push for increased resources and capacity within regulatory agencies
- Sub-strategy: Supporting RD&D and innovation
- Challenge: Clean firm technologies need RD&D and innovation to cut costs, boost efficiency, and decrease risks.
- Philanthropy can: Catalyze additional funding and unlock federal funding
- Examples: Fund policy research to inform appropriations; advocate for government innovation funding; support open-access data and applied research; facilitate technology transfer across industries and countries.
Opening New Sources of Financing
Many clean firm technologies face challenges securing competitive financing for projects, making it difficult to build a single facility, let alone several. There are various reasons for this:
New technologies face financing risks: Many new clean firm technologies struggle to secure financing for projects because they are first-of-a-kind (FOAK) technologies. As a result, they are seen as too high-risk to attract normal project debt financing. Indeed, banks and other forms of private capital are typically only willing to take on risk and finance a project once a technology has been proven. In other words, the technology needs to have demonstrated its capabilities with a sufficient number of successful grid-connected projects and a depth of performance data.31 As a result, clean firm companies must look elsewhere—such as the government, equity investors, and corporate venture funds—for funding to demonstrate and commercialize their technology.
Ensuring these sources of funding remain open, finding new creative financing mechanisms, and socializing the benefits of clean firm technologies will be crucial to their success.32 Without sufficient funding, it will be challenging for any of these technologies to be commercialized and deployed at scale. For example, next-gen geothermal will need roughly $20 billion to $25 billion (USD) in investments across different geologies, and advanced nuclear will need to build 5 to 10 projects of a singular reactor design to pull the technology out of the FOAK stage and to the nth-of-a-kind (NOAK) stage.33
Clean firm technologies tend to have high upfront costs: Many of these FOAK projects have high upfront capital expenditures (CAPEX), especially compared to other clean generation technologies like solar and wind. Technologies such as nuclear, geothermal, and CCUS are larger-scale technologies and may need large CAPEX investments to build out their supply chains and new manufacturing facilities.34 In addition to needing to raise more capital upfront, high CAPEX can make clean firm technologies seem less competitive than other clean energy technologies, despite their different operating lifetimes. For example, while a nuclear reactor has high CAPEX at the beginning of the project, it has a much longer lifetime than other clean energy technologies, such as solar and wind. However, these technologies are still compared over a shorter 20-year period, which does not account for the amortization and cost savings seen over the 80-year lifetime of a nuclear reactor.35 Shifting how our current financing and grid-planning services view the upfront costs of clean firm technologies will be crucial to their success.
Megaprojects carry greater risks: Larger projects, referred to as megaprojects, also face challenges obtaining sufficient funding to complete construction due to the complexities of building something so large. Many times, megaprojects will cost more than expected, and the risk of cost overruns is a major concern for many potential investors, especially for large-scale nuclear projects.36
What can philanthropy do? Ensuring that existing forms of risk-tolerant financing from government agencies are maintained or even expanded can be crucial. Philanthropy can support the creation of innovative financing tools or partnerships that do not already exist but could reduce risk or crowd in new sources of funding. Further, philanthropy can promote best practices that share risk across investors to make it more feasible to invest in megaprojects and mitigate the risk of delays and cost overruns.37
Advocating for Market and Grid Regulatory Reform
Electricity markets and existing regulatory schemes are not designed to accurately value or compensate for the various services that clean firm technologies provide. To start, many utilities use modeling methodologies for power system planning and analysis that do not sufficiently value the benefits of clean firm and dispatchable power.38 For example, many capacity expansion models (CEMs), which are used to conduct grid planning, only consider LDES’s ability to store energy for a day rather than the value and services it provides over multiple days or seasons.39 As a result, LDES technologies appear uncompetitive.
In addition to modeling, standards used to compare the competitiveness of different energy assets do not fairly or accurately represent the firm and dispatchable characteristics of clean firm technologies. For example, the levelized cost of energy (LCOE), an energy comparison standard, spreads costs over a period of 20 to 30 years rather than the actual lifetime of a clean firm technology, which tends to be much longer, meaning costs are not correctly distributed over the lifetime of some clean firm technologies.40
Furthermore, LCOE does not account for the total system costs of a technology. In other words, it does not include the cost to make power firm (provide power consistently and on demand) or to deliver that power.41 If you used a full-system LCOE to account for all these additional costs, technologies such as solar and wind would seem less competitive. For example, in Figure 5, the full-system LCOE of solar and wind is much higher than their LCOEs, while the full-system LCOE of nuclear is much closer to its LCOE. We caution against over-interpreting these results, since the full-system LCOE calculates the costs of electricity supply assuming the generating technology in question and storage are the only sources available in a given market. Nonetheless, the exercise demonstrates that unadjusted LCOE estimates—which are often cited in investment decisions—undervalue dispatchable generation capacity.

In general, the models and standards currently in use make it challenging to select clean firm technologies when planning a project. Even if a clean firm technology is selected, it may still face additional challenges because of a lack of financial compensation for its services. Existing electricity market mechanisms have not been built or updated with clean firm technologies in mind, and as a result, they fail to create a market where clean firm technologies can compete against other technologies.43 For example, wholesale markets tend to set short-term prices, which give technologies that can produce short bursts of energy at a low cost an advantage over clean firm technologies that provide competitive energy over longer periods. Inadequate market structures could ultimately make it harder to build clean firm resources and will likely lead to inefficiencies on the grid.44
However, some clean firm technologies even have trouble in wholesale markets that focus on buying firm power through mechanisms like a capacity market.45 These market mechanisms tend to focus only on power bids between four and six hours of firm power, thereby undervaluing the longer dispatchable services (over 12 hours) provided by clean firm technologies. Clean firm suppliers would be more competitive sellers in capacity markets that recognize the need for clean power sources that can continuously supply energy for a full day, for instance, to power between 12 and 24 hours.46
Additionally, some clean firm power services, such as reliability and transmission benefits, are not valued when planning grid capacity. Moreover, once a clean firm technology is built, electricity markets do not financially compensate for such services, creating yet another barrier to competitiveness.47
Altogether, U.S. energy markets need modernizing to enable and even catalyze the net-zero grid of the future. To do so, they need to accurately value and compensate for the technologies needed to get us there.
What can philanthropy do? Reforming market and grid regulations will require industry input, but would also greatly benefit from philanthropic support. For example, philanthropy can support policy development that facilitates equitable, cost-efficient competition across energy technologies (including generation and storage), or ensure that regulatory efforts adequately account for climate and decarbonization dynamics. Additionally, without philanthropic support, market and grid regulatory reform will proceed at a slower pace and on a smaller scale, limited to areas where industry is willing to risk valuable resources on advocacy.
Building Demand Support
While there has been growing demand for solar and wind energy due to their steep cost declines, we have not seen the same level of demand growth for clean firm power.48 We believe that as some of these clean firm technologies mature and subsequently decrease in cost, they may more naturally compete with natural gas. Having a clear, long-term demand signal could encourage manufacturers to invest in the capacity needed to build clean firm technologies. Additionally, it may provide a market signal to upstream suppliers, encouraging them to invest in the supply chain.
Limited demand has been especially inhibitive for the advanced nuclear industry, where there has been a central “chicken and egg problem”: there are no new nuclear reactor orders without a supply chain, and no supply chain without new orders. Manufacturers need a large, reliable volume of orders to justify investing in new manufacturing facilities, but customers are hesitant to place those orders without a demonstrated track record of low costs and on-time delivery.49
Examples from recent history can help inform how people think about building demand for clean firm power. For instance, Renewable Portfolio Standards (RPS) have helped generate demand for renewables, especially as they have scaled in the last two decades. We think a similar demand tool is needed to support clean firm power. For example, California implemented a clean firm power mandate that has helped generate demand, but similar policy mechanisms do not exist widely across the country.50
What can philanthropy do? Current energy markets have demand signals for cheap and, in some states, clean electricity, but not for clean and firm electricity. Philanthropy can help fill this gap by directly generating demand for these technologies as well as advocating for mechanisms that will generate demand on their own. Without additional support, clean firm industries may struggle to generate demand on a timeline aligned with climate targets.
Ensuring a Robust and Resilient Supply Chain and Workforce
To commercialize clean firm technologies and deploy them at scale, we need to establish resilient supply chains and workforces that can grow at the same pace. We believe these challenges cut across nuclear, LDES, and next-gen geothermal.
Nuclear’s future growth in the U.S. depends on developing robust and reliable supply chains for uranium and critical minerals, enhancing large-scale manufacturing capacity for nuclear plants, and expanding the nuclear energy workforce by hundreds of thousands.51 LDES, though still nascent, faces looming risks around supply chain vulnerabilities and shortages of skilled labor.52 Next-gen geothermal can lean on existing oil and gas (O&G) supply chains, but it also faces vulnerabilities, such as reliance on a handful of foreign turbine manufacturers and challenges in adapting workforce skills to new geological conditions.53
Taken together, these issues reveal shared themes: supply chain gaps in critical equipment, overreliance on a limited number of global suppliers, and the urgent need to develop and transition a skilled workforce. Coordinated strategies that tackle these challenges across technologies will be essential to scaling clean firm power.
What can philanthropy do? Building out secure and resilient supply chains, as well as a skilled workforce, can be difficult. Philanthropy can support the process of building both up by ensuring efforts target the sectors most at risk and that there is sufficient coordination around a strategy.
Addressing Permitting and Siting for Clean Firm Power
We discuss permitting and siting challenges more broadly in “Addressing Clean Energy Deployment Barriers,” but believe it is worth highlighting how technology-specific permitting and siting issues can hold back the deployment of clean firm power. Nuclear, next-gen geothermal, CCUS, and LDES all face versions of the same underlying problems: lengthy and unpredictable approval timelines, complex and overlapping regulatory processes, and limited agency resources to handle new project applications at scale.54
For example, unpredictable timelines to complete the Nuclear Regulatory Commission’s licensing process, which ensures that nuclear power plants are built safely, create uncertainty for investors.55 Similarly, most geothermal projects are on federal land, and historically, geothermal development on federal land has typically taken 7-10 years to complete.56 CCUS faces its own permitting complexities around carbon storage, while LDES encounters general siting and permitting hurdles. In each case, drawn-out and unpredictable processes increase costs, delay commercialization, and deter investment.
What can philanthropy do? Clean firm technology permitting and siting challenges all relate to policy and therefore can benefit from philanthropic support through policy development and advocacy.
Supporting RD&D and Innovation
Nuclear, next-gen geothermal, LDES, and CCUS are not yet mature technologies and would benefit from further innovation to address cost, efficiency, and risk. While the specific research needs differ across technologies, the underlying challenge is shared: all of these technologies depend on sustained RD&D to move from FOAK projects toward widespread, competitive deployment.
Coordinated innovation efforts that span technologies can help unlock system-level benefits, reduce supply chain risks, and build investor confidence in clean firm power as a whole. We see ensuring consistent support across the innovation pipeline as a broader issue that we may look at further as a separate pillar.
What can philanthropy do? Philanthropy can play an important role in advancing clean firm innovation by catalyzing additional funding, filling gaps in applied research and open-access data, and advocating for government RD&D investment.
Prioritizing Philanthropic Levers to Commercialize and Deploy Clean Firm Power
We evaluate each sub-strategy’s scale, feasibility, and funding need below. For more information on these metrics and our research process, see Giving Green’s Research Overview. We excluded funding need due to limited data on available funding. For scale, we took a qualitative approach, focusing on current deployment bottlenecks and considering whether a lever could meaningfully address them. We assumed that addressing the most pressing bottlenecks has the greatest potential for scale, since a technology or policy that is currently constrained by a specific barrier can unlock disproportionately large emissions reductions once that barrier is removed. For feasibility, we considered political and technical factors.
Based on this exercise, we have prioritized the following approaches:
- Opening new sources of financing.
- Advocating for market and grid regulatory reform.
- Building demand support.
- Supporting RD&D and innovation.
All of the listed challenge areas are barriers that must be overcome to deploy clean firm technologies successfully, though not all are equally prevalent or urgent at this moment. The two sub-strategies we did not prioritize—ensuring a robust and resilient supply chain and workforce, and addressing permitting and siting challenges for clean firm power—will become more prevalent as clean firm technologies mature, so they may become future recommendations.
Scale and feasibility of various philanthropic levers that could help commercialize and deploy clean firm power
- Opening new sources of financing
- Scale: High. Limited access to funding makes it challenging for companies to move from FOAK to scaled projects. Unlocking new sources of financing can reduce risks and accelerate deployment, making it a key bottleneck to address. Additionally, creating well-designed financing tools that share risks (e.g., insurance, standardized terms sheets, etc.) could lower barriers to entry for potential customers, facilitate a critical mass of orders, and promote on-time and on-budget delivery.57
- Feasibility: Medium. We think there may be fewer tools to open new sources of financing under the Trump administration. For example, while key statutory lending authorities remain in place at DOE’s Loan Programs Office (LPO), its application pipeline has been stalled, and we think it likely faces headwinds, such as staffing challenges.58 LPO’s previous energy infrastructure reinvestment program has been replaced with a new Energy Dominance Financing mechanism that supports grid resilience and benefits clean firm technologies. However, we think the expansion of the types of projects it supports (e.g., fossil and critical minerals) could shrink the pie for clean firm technologies.59
- Advocating for market and grid regulatory reform
- Scale: High. Clean firm technologies cannot compete or scale without markets that properly value the full range of services they provide. For example, reforming markets for LDES technologies will allow them to be strategically deployed where they are most useful, similar to how reforms made by the Federal Energy Regulatory Commission (FERC) leveled the playing field for battery energy storage technologies and allowed them to be deployed widely.60
- Feasibility: Medium. There are multiple opportunities at the state and regional level to progress market and regulatory reform. We are already seeing growing momentum for market reform in states like California, with more states following. This progress is promising, especially during a time when federal policy is more challenging. However, instituting changes may take time due to lengthy regulatory processes.
- Building demand support
- Scale: High. To drive the deployment of clean firm technologies, consistent sources of demand are needed that give preference to clean firm power over GHG-emitting firm power. The same was needed for VRE sources two decades ago and addressed with the creation of renewable energy portfolio standards.61 Without clear demand pulls for clean forms of firm power, new demand may be met by GHG-emitting firm power.
- Feasibility: Medium. While opportunities at the federal level are more limited under the current administration, there are feasible opportunities at the state and regional levels to pass clean firm power requirements, as seen in California, or to combine clean energy targets with firm capacity demand policies. There are also opportunities to engage with the private sector and to continue building demand for clean firm technologies.
- Ensuring a robust and resilient supply chain and workforce
- Scale: Low. We believe supply chain and workforce capacity are important for scaling clean firm technologies, but they are not the main constraint right now. We think that at this stage—moving from FOAK to NOAK projects—companies can manage with their existing supply chains and workforces, and that other challenges are the larger bottlenecks. However, as industries grow and move closer to commercialization, supply chain and workforce challenges are likely to become more pressing.
- Feasibility: Medium. Building supply chain and workforce capacity appears feasible, though challenges differ by technology. For next-gen geothermal, workforce development may be easier since skills and assets can transfer from the O&G sector. We think newer industries may need to build talent pipelines from scratch and overcome career-risk concerns. Overall, we believe talent development is achievable through training programs and fellowships, as it is not a technical barrier. Supply chain development is less predictable because it may hinge on uncertain factors such as geopolitics and technological progress.
- Addressing permitting and siting challenges for clean firm power
- Scale: Medium. Reforms to permitting and siting can speed up deployment and de-risk technologies by reducing costs and making project timelines more predictable. Because there are still pathways forward for clean firm technologies even without reform (e.g., advanced nuclear reactors can be licensed under existing licensing rules), we see permitting and siting challenges as a less pressing bottleneck to deploying clean firm technologies.
- Feasibility: Medium. There has been momentum for reforming permitting and siting related to clean firm technologies, such as the steps the Bureau of Land Management has taken to apply a categorical exclusion to geothermal resource confirmation on public lands and the licensing wins for nuclear included in the ADVANCE Act and Nuclear Energy Innovation and Modernization Act.62 At the same time, regulatory agencies need more capacity; we think they will continue to face staffing constraints under the Trump administration.
- Supporting RD&D and innovation
- Scale: High. Clean firm technologies have made significant strides in the last few years; however, there remains a need for ongoing RD&D support to help them reach commercialization more quickly. In other words, continued RD&D support will allow clean firm technologies to reduce costs and risks, while simultaneously making them more reliable and efficient.
- Feasibility: Medium. Historically, innovation has garnered bipartisan support. However, given recent federal efforts targeting certain clean energy technologies, it is unclear how the Trump administration will approach innovation in clean energy. Nevertheless, this administration has shown support for certain clean firm technologies, such as nuclear and geothermal, indicating there are likely pathways to advance clean firm innovation at the federal level. Additionally, Congress will have influence on federal RD&D through the appropriations process—meaning the current (119th) and upcoming (120th) Congresses—by deciding how funding is allocated to agencies like DOE.
Theory of Change for Philanthropic Engagement
Theories of change (TOCs) enable us to better understand the pathways of influence, the likelihood of each pathway, and avenues of greatest impact for philanthropic and civil society efforts. There are various pathways to supporting clean firm power and lowering emissions. To help visualize the theoretical impact of different philanthropic sub-strategies, we developed a TOC that lays out the intended outputs and outcomes that lead to emission reductions (Figure 6).
This TOC provides a high-level view of progress and does not cover the intricacies and other potential unforeseen external factors that may influence or derail a philanthropic engagement. The TOC also does not cover technology-specific efforts that may still be necessary to advance a clean firm technology, which are outside this report’s scope. Such efforts, however, will undoubtedly support the outputs and outcomes covered in the ToC graphic.
It is important to note that while this report focuses on U.S. clean firm action, we believe there are potential outcomes that support the deployment of clean firm technologies and, in turn, reduce emissions outside the U.S., as seen in the TOC below.

-----
17 We consider natural gas with CCUS to be clean because CCUS technologies capture and store CO2 from natural gas. We note that CCUS has risks, such as the potential for CO2 leakage from storage sites and extending the use of fossil fuels.
18 Figure 3: Select elements of nuclear’s value proposition as compared to other power sources. Kozeracki et al, 2023.
19 “Wind and solar provide most (60%–80%) of the generation in the least-cost electricity mix in allthe main scenarios.” NREL, 2022.
20 “Nuclear capacity more than doubles in the Constrained scenario, reaching 27% of generation, while limited growth in the other three core scenarios results in a contribution of 9%–12%, largely from the existing fleet. The overall generation capacity grows to roughly three times the 2020 level by 2035, including a combined 2 TW of wind and solar. This would require growth rates in the range of 43–90 GW/year for solar and 70–145 GW/year for wind by the end of the decade, which would more than quadruple the current annual deployment levels for each technology in many scenarios. Across the four core scenarios, 5–8 GW of new hydropower is deployed by 2035 by adding capacity at unpowered dams and uprates at existing facilities, while geothermal capacity increases by about 3–5 GW by 2035.” NREL, 2022.
21 “In deeply decarbonized electricity systems with significant shares of variable renewable energy, the additional availability of at least one firm electricity generating technology can overcome reliability challenges and substantially reduce electricity costs.” Baik et al, 2021.
22 Curtailment: “Rates of total VRE curtailment in such systems can reach 35%–50% (similar to ‘‘curtailment’’ rates for thermal units on an energy basis); marginal curtailment is much higher for new VRE capacity built to meet the last few percent of decarbonization or demand.” Mai et al, 2022; “Without clean firm resources in the ReB scenario, significant capacities of PV and energy storage must be overbuilt to ensure energy adequacy and reliability in periods of low renewable energy output. Due to the limited capacity expansion potential of other renewables resources such as wind, geothermal, and hydro, most of the renewable expansion in-state is dominated by PV and storage resources. Despite the low capital costs of PV and energy storage, the sheer volume of capacity required and the subsequent decrease in marginal value and utilization rates for PV and storage resources result in higher system costs for the ReB scenario.” Baik et al, 2021.
23 “We estimate that wholesale electricity rates would increase by about 65% over today if renewable energy and currently available storage technologies alone were to be used to meet demand in 2045 [in California]. Furthermore, even if consumers were willing to pay that premium, it may simply not be possible to build renewable facilities at this scale. Getting to nearly 500 gigawatts by 2045 would require expanding solar capacity at a rate 10 times higher than has ever been done before. There may not be enough people, supplies, or land to do this.” Issues in Science and Technology, 2021.
24 “System-level decarbonization modeling suggests that the U.S. will need to quadruple the existing clean firm power supply available on the grid today, adding between 700 and 900 GW by 2050 to build a decarbonized, functioning grid system capable of supporting wind and solar buildout and increased demand.” DOE, 2025.
25 See “Figure 4: Additional clean firm power needed for the United States to reach grid decarbonization goals by 2035, across three different economy-wide assessments.” DOE, 2025.
26 Onshore wind decreased from $186 per MWh in 2009 to $49 in 2024. Solar solar photovoltaics dropped from $496 to $60 per MWh over the same time period. See "How did the price of electricity from new power plants change over the last 15 years?" Our World in Data, 2020.
27 Using nuclear power as an example: “Waiting until the mid-2030s to deploy new nuclear at scale could lead to missing decarbonization targets and/or significant nuclear supply chain overbuild. If deployment starts by 2030, ramping annual deployment to 13 GW by 2041 would provide 200 GW by 2050; a five-year delay could require 20+ GW per year to achieve the same 200 GW and could result in as much as a 50% increase in the capital required.” DOE, 2024.
28 Using nuclear power as an example: “Waiting until the mid-2030s to deploy at scale could lead to missing decarbonization targets and/or significant supply chain overbuild. Committing to rapidly scaling the nuclear industrial base will increase capital efficiency and enable nearer-term decarbonization. If deployment at scale begins in 2030 and throughput is ramped up to 13 GW per year over the next 15 years, 200+ GW of new nuclear capacity can be achieved by 2050; however, a five-year delay in scaling the industrial base would require 20+ GW per year of throughput to achieve the same target. Delivering projects at that rate and scaling a supply chain to 20+ GW could come at significantly higher capital costs, both overall and for the marginal unit (Figure 22).” Kozeracki et al, 2023.
29 Support for nuclear and geothermal: “Energy Secretary Chris Wright called on lawmakers Monday to keep tax incentives for nuclear and geothermal energy in place through 2031 — marking a direct request from a key Trump administration official to lawmakers as they reconsider cuts sought by House Republicans to energy incentives enacted by Democrats.” E&E News, 2025; Sparing of nuclear and geothermal tax credits: “Nuclear power was notably spared in the House’s gutting of clean energy incentives, but it got a few new friends in the Senate iteration. Like battery storage and advanced nuclear, geothermal and hydropower projects will be able to tap 45Y production tax credits until 2036.” Canary Media, 2025.
30 “It is worth noting that project finance requires a high level of repetition and deep benchmarking of engineering and performance data. Banks will only consider financing those solutions already deployed at scale multiple times. Those technologies able to reach scale maturity first will attract more follow-on investment and continue to improve, creating even more distance with the other options and driving them out of the market, unless there are new technology breakthroughs with dramatic performance improvements.” DOE, 2023. There are additional challenges beyond a technologies readiness, such as the risk of generating revenue or the cost of a project being more than expected, that can make clean firm technologies less bankable. Many of the other challenges discussed in the clean firm section of this report will impact a projects ability to receive financing. Clean Air Task Force, 2025.
32 “Demonstration in 5-10 separate geologic settings can reduce risk and verify resource availability, catalyzing commercial liftoff in the U.S. by 2030. This corresponds to 100+ developments, 2-5 GW of overall deployment, and $20-25 billion of investment before 2030.” DOE, 2025. “To realize economies of scale and get to NOAK costs, at least 5-10 reactors of one standardized design need to be built” DOE, 2024
33 Nuclear, geothermal, LDES, and carbon management liftoff reports, and Selänniemi, Hellström, Björklund-Sänkiaho, 2025
34 “Integrated resource plans (IRPs) with time horizons of ~15-20 years are evolving to better optimize the cost of low carbon systems, but many still do not account for an explicit cost of carbon or willingness of customers to pay for clean power. Assumptions for nuclear construction costs may be overestimated given limited reference points overweighted by recent experience. Nuclear, with 80 years of operations, provides low priced power for future ratepayers for decades (potentially ~50 years) after construction has been paid off (typically ~30 years)” DOE, 2024
35 DOE, 2024
36 Institute for Progress, 2023; DOE, 2024
37 Power system planning and analysis refers to integrated resource planning (IRP), resource adequacy studies, and transmission planning services; “Unlocking this [LDES resource adequacy] value in many jurisdictions will require changes to modeling methodologies for integrated resource planning, resource adequacy studies, and transmission planning. Market and regulatory dynamics must also evolve to recognize the need for longer duration, firm, dispatchable power.” DOE, 2023
38 “...current capacity expansion models used in long-term planning processes rarely consider low cost LDES as a candidate technology. If they do, the storage balancing horizon (SBH) of the model usually only considers non-consecutive 1-day periods that do not capture the potential of LDES to shift energy across multiple days or even seasons.” Sánchez-Pérez et al., 2023
39 LCOE is a calculation of the cost to produce energy for a given technology and is normally represented on a $/MWh basis. To calculate LCOE you divide the total investment, operational, and maintenance expenditures of a project by the amount of energy produced. DOE Office of Indian Energy, n.d.
40 “Secondly, to use the same life-span and discounting across technologies is not only illogical due to the nature of different energy technologies, but it also fails to take into account the various investor categories that would invest in the different energy sources and violates financial theory” Emblemsvåg, 2025
41 “LCOE is an imperfect metric with which to compare firm resources to variable resources because it does not reflect total system costs. LCOE measures only average generation irrespective of the time it is produced, which excludes two key categories of cost: delivery cost and firming cost.” DOE, 2024
42 Emblemsvåg, 2025 use of a Bank of America analysis. “Sadly, the report is short on methods and explanations. However, the report does seriously question the realism of the LCOE estimates used today for policymaking.” As Emblemsvåg explains, this figure should not be taken as exact but rather be interpreted as a representation of the disconnection between LCOE and full system LCOE.
43 “Without market structures that value generation systems that can simultaneously provide firm, clean, flexible power, geothermal power will struggle to be cost-competitive against portfolios of natural gas, wind, and solar.” DOE, 2025
44 “Current short-term electricity market incentives can lead to long-term inefficiencies. Competitive wholesale markets with short-term price setting that does not account for GHG emissions can make large-scale investment in clean firm generation challenging; it is not clear they provide incentives to support large scale investment in new clean firm generation necessary in 2024.” DOE, 2024
45 Capacity markets - “A capacity market pays power suppliers for their commitment to meet future electricity needs. A capacity market does not pay for the energy produced but instead pays for the ability to produce power when needed.” FERC, 2025
46 “The regulatory and market change also requires identification of the differentiated need for longer duration, firm, dispatchable power in addition to the monetary compensation (e.g., expanding from 4–6-hour firm capacity products to longer duration such as 12 hour and 24-hour firm based on market need)” DOE, 2023; “Broader electricity market reforms could incentivize investment in new clean firm assets, e.g., longer term capacity markets and other revenue sources for clean firm generation.” DOE, 2024
47 “There are many reliability and transmission benefits that LDES systems can provide that markets do not yet fully compensate. Predictable compensation for LDES resource adequacy benefits—(roughly equivalent to an additional ~$50–75 per kW per year by 2030i when considering other potential energy market payments)—would be one of the direct ways to support a business case for investment” DOE, 2023
49 “Commercialization Risk. Even after a reassuring demonstration, there are challenges associated with commercial deployment, such as overcoming the project management cost and schedule delays that have plagued nuclear construction in the United States and Europe; establishing supply chains for fuel, parts, and components of sufficient quality, volume, and price; developing a sufficient order book to justify the establishment of a manufacturing facility; and ensuring the availability and cost of the necessary skilled workforce both for construction and operations.”National Academies of Sciences, Engineering, and Medicine, 2023.
50 "Of the 11,500 MW NQC required, 2,000 MW must be from resources with long development lead times. This procurement will increase resource diversity and enhance grid reliability. At least 1,000 MW must be obtained from long duration storage resources (eight hours or greater), and at least 1,000 MW from clean firm resources such as geothermal. (“Firm” means providing power whenever needed, for as long as needed.)" - California Public Utilities Commission, n.d.
51 Uranium: To ensure a secure supply and meet expected nuclear capacity growth, the U.S. and its partners need to ramp up their mining and milling, conversion, and enrichment, and fabrication. “Mining and milling: The US would need access to ~55,000-75,000 MT per year of U3O8 mining/milling capacity to support 300 GW of nuclear capacity; it currently has ~2,000 MT of capacity and procured ~22,000 MT. … Conversion: The US would need access to ~70,000-95,000 MT per year of UF6 conversion capacity to support 300 GW of nuclear capacity; it currently has ~10,400 MT per year of UF6 conversion capacity… Enrichment: The US would need access to ~45-55M SWU per year to support 300 GW of nuclear capacity; existing US uranium enrichment capability is ~4.4M SWU, while current US demand is ~15M SWU… Fabrication: The US would need to access ~6,000-8,000 MTU per year to support 300 GW of nuclear capacity; it currently has ~4,200 MT per year of uranium oxide (~3,700 MTU).” DOE, 2024; Critical minerals and large-component forging and manufacturing: See Figure 46: High level overview of nuclear component supply chain. DOE, 2024; Workforce: “The US would need an additional ~375,000 workers with technical and non-technical backgrounds to support the deployment and operation of 200 GW of new nuclear by 2050; today it has ~100,000 supporting ~100 GW. ~100,000 would be required to operate the 200 GW of new reactors in 2050 and ~275,000 would be required for construction and manufacturing.” DOE, 2024.
52 See Figure 14 in the linked report: Inter-day LDES systems have fewer supply chain vulnerabilities compared to Li-ion alternatives and Figure 15: Multi-day / week LDES systems have moderate potential supply chain risks, but there are opportunities to mitigate these risks. DOE, 2023.
53 “Modern-day geothermal wells and power plants require three essential technology verticals for development: drill rigs to construct the wellbore, tubulars and casings to seal the well, and organic Rankine cycle (ORC) turboexpanders (a specialized class of turbine) to convert the earth’s heat into electrons… Lastly, the industry for ORC turbines is ripe for disruption, with just five manufacturers in operation whose factories are split between Italy, Israel, China, and increasingly in Türkiye, as well.” Carnegie Endowment for International Peace, 2025.
54 Using nuclear as an example for limited agency resources: “To achieve 13 GW per year, the NRC might have to increase staff by ~500 dedicated license reviewers, with likely an additional 300–500 subject matter experts.” DOE, 2024.
55 “Predictable licensing timelines, e.g., within 2–3 years, have been highlighted by investors and other stakeholders as a key factor for enabling deployment at scale.” DOE, 2024
56 “Historically, geothermal project development timelines typically have been 7-10 years for projects on public land.” DOE, 2025
57 Using nuclear as an example: See Figure 3: Nuclear projects have a variety of tools to share and reduce costs and risks. DOE, 2024
58 “Key statutory lending authorities remain in place, as well as some credit subsidy funding from non-IRA sources. But LPO’s pipeline remains stalled. No new applications have been submitted; no conditional commitments have been finalized; and while previously completed loans have now been receiving their payouts from the office, no new loans have been closed.” Latitude Media, 2025.
59 “July’s One Big Beautiful Bill Act replaced the LPO’s previous energy infrastructure reinvestment program with a new Energy Dominance Financing mechanism. It broadens the scope of eligible projects to include those related to critical minerals and emphasizes grid reliability, while potentially excluding some previous greenhouse gas emission reduction projects. For nuclear energy, this could mean a clearer pathway to financing through a new eligibility category specifically supporting projects that enhance grid reliability, directly benefiting nonintermittent and baseload power sources like advanced nuclear reactors. But the expanded eligibility may also shrink nuclear’s slice of the pie, according to Matt Bowen and Ashley Finan of Columbia University’s Center on Global Energy Policy.” E&E News, 2025
62 Geothermal: “The Bureau of Land Management has finalized a new categorical exclusion that will help to accelerate the discovery of new geothermal resources on public lands. The newly approved categorical exclusion will apply to operations to confirm the existence of a geothermal resource on public lands.” U.S. Bureau of Land Management, 2025; Nuclear: ADVANCE Act: “It also requires the Nuclear Regulatory Commission (NRC) to (1) develop a process that enables timely licensing of nuclear production facilities or utilization facilities at brownfield sites, and (2) establish an initiative to enhance preparedness and coordination with respect to the qualification and licensing of advanced nuclear fuel. NRC may hire specialized staff without regard to civil service laws to address its critical licensing or regulatory oversight needs.” congress.gov, n.d.; NEIMA: “This bill revises the budget and fee structure of the Nuclear Regulatory Commission (NRC) and requires the NRC to develop new processes for licensing nuclear reactors, including staged licensing of advanced nuclear reactors.” congress.gov, n.d.
Addressing Clean Energy Deployment Barriers
Key ideas: Powering a modern grid
1. Recent policy wins have driven major growth in clean energy, but face mounting headwinds. The Infrastructure Investment and Jobs Act (IIJA) and the Inflation Reduction Act (IRA) helped add 229 GW of new capacity between 2020 and 2024, with projections of up to 850 GW by 2030. Sustaining this pace without tax incentives will depend on removing structural deployment barriers.
2. Policy shifts and structural barriers risk derailing the momentum in clean energy. The rollback of IRA tax credits under the One Big Beautiful Bill Act, combined with persistent permitting and grid challenges, could slow renewable deployment to well below the levels needed to achieve U.S. decarbonization goals.
3. Philanthropy can unlock faster clean energy deployment by targeting key bottlenecks. Strategic funding to reform permitting, streamline local siting, and modernize interconnection processes can help remove the structural barriers slowing U.S. progress toward grid decarbonization.
Consequences of Deployment Barriers
The U.S. has seen a recent spur in solar and wind energy generation capacity and battery deployment, adding roughly 229 GW of capacity between 2020 and 2024.63 The passage of the Infrastructure Investment and Jobs Act (IIJA) and the Inflation Reduction Act (IRA) drove many of these investments, and were projected to add a combined total of 390 to 850 GW of solar, wind, and battery storage capacity by 2030. These investments would result in roughly 44 to 93 GW of solar and wind capacity and 5 to 12 GW of battery storage being deployed every single year between 2023 and 2030.64 While these projections equate to a massive power sector emissions reduction—a 72% to 91% reduction below 2005 levels—achieving such a large buildout of clean power depends on overcoming a variety of deployment barriers.65
Deployment rates and decarbonization targets will become even more challenging to meet after the passage of the One Big Beautiful Bill Act (OBBBA). Projected deployment of solar and wind will decrease significantly compared to a scenario where IRA tax credits had been maintained. However, the market will still spur heavy growth in these sectors. By 2030, we could see an average deployment of 33 to 35 GW of solar, wind, and batteries (Figure 7). Again, these projections face one major uncertainty: there are still significant deployment barriers that could hold back the buildout of VRE.66 To continue deploying high levels of VRE, especially without tax incentives, the U.S. needs to remove barriers to deployment.

Deployment Challenge Areas
We identify three major opportunities for addressing barriers to clean energy deployment:
- Streamlining and accelerating federal permitting.
- Removing and preventing local permitting and siting roadblocks.
- Modernizing the interconnection process and clearing the backlog.
We believe philanthropy has the opportunity to drive progress across all three barriers and to ensure the U.S. continues to make strides toward decarbonizing the grid. We briefly describe these challenges and opportunities and describe these challenges further in the sections below.
- Strategy: Streamlining and accelerating federal permitting
- Challenge: Permitting is transmission's largest bottleneck, and federal reform could significantly accelerate—or set back—clean energy deployment in the coming years.
- Philanthropy can: Inform and guide policy discussions to ensure federal permitting reform hastens clean energy deployment.
- Examples: Support government engagement and policy development; conduct policy modeling
- Strategy: Removing and preventing local permitting and siting roadblocks
- Challenge: Local siting and permitting challenges are widespread and could stall clean energy momentum.
- Philanthropy can: Prevent and reverse restrictive local policies
- Examples: Support government engagement and policy development; fund research; build new climate grassroots networks; build diverse alliances across issue areas
- Strategy: Modernizing the interconnection process and clearing the backlog
- Challenge: Interconnection queue backlogs are limiting the effectiveness of policies designed to drive clean energy deployment.
- Philanthropy can: Drive change through education, thought leadership, and government engagement
- Examples: Support government engagement and policy development
Streamlining and Accelerating Federal Permitting
Key ideas: Streamlining and accelerating federal permitting
1. Permitting is a major bottleneck for clean energy and transmission projects. Large-scale and interstate projects face lengthy and overlapping local, state, and federal reviews that can delay deployment for years or lead to cancellations.
2. Transmission expansion is essential but severely constrained by permitting delays. The U.S. must roughly triple transmission capacity by 2050 to meet decarbonization goals, yet current approval processes—averaging seven years per project—make this pace unattainable without reform.
3. Federal and state fragmentation creates systemic inefficiencies. Limited agency capacity, poor interagency coordination, and inconsistent state participation all contribute to multi-year delays and discourage critical interregional projects.
4. Permitting reform should streamline processes without weakening environmental protections. Effective reform would improve efficiency, reduce litigation-related delays, and maintain safeguards to balance climate progress with environmental integrity.
All energy facilities require permits at the local, state, and interstate levels, but only transmission lines and large-scale projects typically require federal permits.68 In recent years, federal permitting has become increasingly challenging, resulting in delays or even cancellations of energy infrastructure projects.69 These challenges generally fall into two categories: (1) transmission permitting issues, and (2) broader federal permitting issues affecting large-scale energy projects such as nuclear, geothermal, and utility-scale solar facilities.70 We believe that both of these federal permitting challenge areas can benefit from additional philanthropic support.
Building More Transmission
Transmission buildout is crucial to deploying high rates of renewables: For VRE deployment to continue growing, transmission will be needed to connect remote areas with concentrated wind and solar resources to centers of demand further away.71 Beyond decarbonizing the grid, expanding transmission capacity will also be critical for reliability and resilience as electricity demand rises.72 Several of the reliability and resilience services that are provided by transmission buildout are listed in Figure 8.

Looking ahead, to meet projected electricity demand, the U.S. transmission system will need to grow substantially: by 2050, the transmission system must be 2.1 to 2.6 times the size of the transmission system in 2020, and between 2.4 and 3.5 times larger if we are to achieve a 90% reduction in grid emissions by 2035 and 100% by 2050.74
The U.S. is not building enough transmission: Despite the clear need, transmission buildout remains far below required levels to meet our climate targets. To meet even the minimum projected demand growth by 2050, the U.S. will need to build 5,000 miles of new transmission lines each year—a pace far higher than what has been achieved over the last 15 years (Figure 9).75

There have been recent policy efforts, however, to support the buildout of transmission, such as the Federal Energy Regulatory Commission (FERC) Order 1920. This FERC order requires all transmission planning regions to conduct detailed, long-term, scenario-based transmission planning, something many regions do not currently do.77 In the long run, we expect that such regionalized transmission planning will help identify more potential transmission projects and improve coordination; however, it will not overcome the deeper barriers that have slowed transmission deployment to date.
Permitting is holding back transmission buildout: A major barrier is the challenging, complex siting and permitting process. Throughout this process, multiple government jurisdictions—from the local to the federal level—will oversee and permit a transmission line, creating numerous opportunities for delay, especially when a project crosses state lines.78 Federal permitting alone can take years, with transmission projects averaging seven years to receive approval compared to three years for natural gas pipelines (Figure 10).79 This imbalance in permitting timelines strongly suggests areas for improvement in transmission permitting.

Longer transmission lines, which are often required to connect renewable resources, face even greater permitting hurdles. For example, while only 3.6% of transmission projects between 2010 and 2020 underwent a full Environmental Impact Statement (EIS) process—the most stringent environmental review under the National Environmental Policy Act (NEPA—these projects accounted for 26% of all transmission miles built during this time period.81
Some of the permitting challenges causing transmission delays stem from general issues that also affect other types of projects, as discussed in the section below, but transmission also faces its own specific permitting hurdles. Many of these challenges stem from the fact that most transmission permitting is conducted at the local and state levels. For example, many states have limited staff and budgets that keep them from actively participating in transmission planning before the permitting process. If they can, states may even be reluctant to plan or permit interregional transmission over the fear they would be subsidizing other states’ benefits at the expense of their own constituents.82 However, if a state decides to plan a transmission project and move on to permitting, various local and state offices will review the transmission project to determine which permits it needs, creating an arduous and lengthy process. To add further complication, a transmission project may require time-bound permits, such that a holdup with one permit could lead to the expiration of others.83
Without reforms, delays will reduce the deployment of VRE and push the grid toward a greater reliance on natural gas and even coal (Figure 11).84 In line with the proposals of many experts—and despite opportunities to improve state and local processes—we believe federalizing the transmission siting permitting process to avoid the complexity and inefficiencies of the current process represents a high-impact opportunity that could benefit from philanthropic support.85

What can philanthropy do? Philanthropy has a clear role in driving transmission buildout by educating policymakers on the importance of the issue and developing new policies to address permitting challenges. Funders can support research on policy design and impact, coordinate stakeholders, and advocate for federalizing or modernizing transmission permitting to accelerate clean energy deployment.
Other areas to explore in the future: Permitting is a major and immediate roadblock to the buildout of transmission; however, there are additional financing, planning, operational, and market challenges holding transmission back.87 While this report does not cover these challenges, we may look into this area in the future. Similarly, we may explore other advanced transmission technologies, such as grid-enhancing technologies and advanced conductors, which could help improve the performance of existing infrastructure and support the deployment of clean energy alongside transmission buildout.88
Avoiding General Federal Permitting Delays
All clean energy and transmission projects require permitting from local and state governments. However, relatively large projects and projects sited on federal land often need a host of federal permits. In total, there are roughly 50 federal permits that may be relevant to a clean energy or transmission project. Most of these permits fall under three categories: wildlife protection, air and water protection, and federal/protected land usage.89 Projects that require a federal permit must also comply with federal procedural laws. The most common example is NEPA, which requires a project to assess any potential environmental impact through an environmental assessment (EA) and, if significant impacts are identified, a more stringent EIS. It is important to note, however, that NEPA does not normally apply to small projects through a categorical exclusion.90
Federal permitting can delay critical generation and transmission projects by years: On average, energy generation and transmission projects require five to six years to obtain federal permits.91 Although not all clean energy projects are subject to federal review, larger-scale technologies—such as nuclear power plants—or those with potential siting opportunities on federal lands—including geothermal and solar projects in the Midwest—are more frequently affected by federal permitting requirements.92 It is also uncommon for a project to require only a single federal permit; most projects must secure at least two to four.93 Each additional permitting requirement increases the likelihood of multi-year delays (Figure 12). These delays not only raise overall project costs but also impede the timely deployment of new capacity at a moment when demand growth is accelerating faster than supply.94

NEPA is a challenge, but not the sole problem: NEPA reviews, which have been at the center of permitting debates, are not the primary obstacle for most projects. For example, between 2010 and 2023, roughly 10% of new solar capacity and 3.7% of new wind capacity were subject to NEPA review. This represents a relatively small share of new VRE capacity and has not been a significant factor constraining overall solar and wind growth. Nevertheless, NEPA can still create delays for a subset of high-capacity VRE projects and therefore remains a barrier to deployment.96 Other clean energy technologies, such as nuclear and transmission lines, however, face a greater threat of NEPA reviews and subsequent delays.

For example, a new geothermal plant may be subject to as many as six separate NEPA reviews during its development, creating a substantial risk of delay and extending project timelines by several years. For context, NEPA reviews for geothermal lease nominations alone take between one and four years to complete.98 Figure 13 shows the average timeline for completing a single EIS across clean energy technologies, highlighting the long (2-3+ years, on average) and varied (frequently 7 and up to 12 years) delays such reviews can impose. Despite the apparent challenge, especially for technologies like transmission, we are unsure whether NEPA reform will lead to deep impacts across all clean technologies.99 However, we still believe that further federal permitting research and policy development that includes NEPA is an impactful area for philanthropy to engage in.100
Challenges behind federal permitting delays: Given the widespread nature of federal permitting, there is no single challenge responsible for delays. Instead, there are many potential factors that experts point to:
- Federal agencies face capacity constraints: Insufficient funding, staffing, and access to necessary technologies at federal agencies responsible for reviewing permits and conducting NEPA assessments have repeatedly been cited as sources of delay. Over the last two decades, different studies have found that deficiencies in one of these three areas have led to permitting delays in federal agencies.101 Recent cuts to federal agency funding and a reduction of roughly 300,000 federal employees may further exacerbate these challenges, although the full implications remain uncertain.102
- Federal permitting requires interagency coordination: With multiple agencies involved in a project's permitting process, there is potential for coordination inefficiencies. Improvements in interagency coordination from policies such as Title 41 of the Fixing America’s Surface Transportation Act (FAST-41) and the Federal Permitting Improvement Steering Council (FPISC) only apply to specific sets of projects, leaving room for improvement.103
- Federal permitting can face legal challenges and judicial review: A large challenge with federal permitting, especially regarding NEPA, is the delay caused by legal challenges and judicial reviews. Various clean energy projects have faced legal challenges based on their permitting, and especially regarding their NEPA findings (Figure 14).104

While most NEPA litigation is filed to reduce environmental impacts, there have been cases where NEPA litigation has been used as an obstructionist tactic to promote personal benefits.106 In both cases, lawsuits against projects tend to end in favor of the federal agencies conducting the NEPA analysis; however, despite the outcome, litigation still extends a project’s timeline and leads to expensive delays.107 On average, district courts have come to a ruling within a year, and cases that were appealed to the appellate courts have taken at least an additional two years to reach a final ruling.108
The goal is permitting reform, not repeal. It is important to note that while there is room for improvement in permitting, existing permitting laws should not be dismantled. Several experts have shared their concerns regarding the potential negative implications if current federal law is substantially weakened.109 Permitting reform must focus on improving the efficiency of the permitting process and eliminating waste and abuse, while ensuring permits continue to function as intended.
What can philanthropy do? We believe there are areas for philanthropy to better inform and guide policy discussions surrounding federal permitting reform that can hasten the economic deployment of clean energy.
Removing and Preventing Local Permitting and Siting Delays
Key ideas: Removing and preventing local permitting and siting delays
1. Local and state siting rules have become a major barrier to renewable energy deployment. Across 44 states, 459 local governments and 16 states have enacted restrictive siting policies, resulting in nearly 500 contested renewable projects in 2024 and sharply reducing available land for wind and solar development.
2. Restrictive permitting and siting ordinances could dramatically limit renewable energy potential. NREL modeling suggests existing local ordinances could cut solar capacity by up to 38% and wind capacity by up to 87%, with additional restrictions likely worsening the impact.
3. Political polarization and local concerns are driving opposition. While renewable energy has become increasingly partisan—especially among Republican legislators—most local opposition stems from perceived risks to land value, aesthetics, or environmental impacts rather than ideological opposition to clean energy itself.
4. Technology-agnostic siting reform could enable bipartisan progress. Because siting policies tend to pass only in politically unified states, reform efforts that apply to multiple energy types (including fossil fuels) may be more feasible in divided governments and could still accelerate clean energy deployment.
Before a renewable project begins construction, it must comply with local siting policies to ensure it is in an eligible location and meets all design requirements. These siting policies, and the relevant regulatory authority that oversees them, vary between states and may even vary across local governments within a state.110 At a high level, there are five ways a state may decide to allocate its siting authority for clean energy:111
- The local government has primary control over siting.
- The state government has primary control over siting.
- Both local and state governments will have some level of control over siting.
- The local government will have control over siting, subject to state-imposed guardrails.
- There are minimal to no siting regulations, and landowners have control over siting.
However, most states use a combination of these approaches by creating multiple pathways for siting and permitting that often vary by project size or, in some circumstances, provide a selection of pathways for developers (Figure 15).

Beyond these pathways, states will also apply different restrictions and requirements for clean energy siting and permitting, making every state's approach unique, even if they share a foundational approach to siting and permitting (see examples of these variations in Appendix D). While multiple siting and permitting approaches add complexity, they give states flexibility to tailor processes to their needs.113 For example, a state may make siting standards for clean energy resources that are widely available in its region more restrictive to manage buildout.
Growing clean energy siting challenges: Across the U.S., local governments increasingly challenge and prevent the construction of renewable energy projects through local ordinances that severely restrict or ban the siting of renewable energy projects.114 In total, 459 local governments across 44 states, as well as 16 states themselves, have enacted restrictive siting policies for renewable energy projects, resulting in at least 498 contested renewable energy projects in 2024.115 The breakdown of local government restrictions and the number of contested renewable energy projects are not concentrated in Republican- or Democrat-leaning states (Figure 16).

A study from the National Renewable Energy Laboratory (NREL) found that the level of local ordinances in 2022, which is lower than the number at the end of 2024, could reduce solar and wind energy up to 38% and 87%, respectively.117 This modeling also considered only the impact of setback ordinances on available land for renewable energy projects and, therefore, on the amount of potential generation. When taking into consideration other types of ordinances, the total impact could be much greater.118
While we do not yet have final data for 2025, current state-level renewable energy siting restrictions also seem to be growing. Nearly 150 state bills have been introduced so far this year that restrict the siting and deployment of renewable energy. States with the greatest level of renewable energy deployment in the last decade are also the states that have introduced the greatest number of restrictive bills.119 The number of bills passed so far this year that have made siting renewable energy either easier or more challenging, however, has been roughly even (Figure 17).

Due to the immense restrictions on clean energy siting generated by local and state policies, we believe state and local siting policy reform is a key area for philanthropic engagement.
Motivation behind siting restrictions: It is challenging to pinpoint the exact cause of the growing siting restrictions for renewable energy. However, there are lessons we can learn from national political shifts and past project opposition.
Nationally, there is a political bifurcation of support for renewable energy. A recent Pew Research Center survey found that in 2020, 65% of Republicans and 91% of Democrats were supportive of expanding renewable energy over expanding exploration and production of fossil fuels. However, in 2025, only 33% of Republicans preferred expanding renewables, while 86% of Democrats still strongly supported expanding renewable energy.121 In other words, since 2020, Republican support for expanding renewables and expanding fossil fuel exploration and consumption has flipped. While this survey does not provide insights into why Republicans’ views have changed, it does show that renewable energy has become politicized. This shift in Republican support could explain the increase of restrictive siting policies recently introduced at the state level, as Republican-led siting bills have been disproportionately restrictive toward renewable energy.122 However, it does not necessarily explain the increase in restrictive local ordinances country-wide, especially in predominantly Democratic states.
Local opposition is complicated, with projects normally facing multiple sources of opposition.123 A recent study found that the most commonly cited challenges across projects are risks to land value and potential environmental impacts.124 These two risks affected roughly 50% of all projects studied.125 The study also found that opposition normally was not rooted in “disapproval of renewable energy” but rather in local and project-specific concerns, whether factual or perceived. Opposition to renewable energy projects may also differ between rural and urban areas. A 2024 Pew Research Center study found that rural residents were more likely to perceive negative impacts to the landscape, while they were less likely to perceive local economic benefits (Figure 18).126

The challenging political and cultural nature of renewable energy opposition makes solving the siting challenge at the local and state levels difficult. We are uncertain whether these challenges can be resolved quickly; however, we do believe that their resolution is a critical area for philanthropic involvement due to the scale of the issue.
Technology-agnostic reforms: In 2025, state siting bills were only passed in states where a single party held both legislative bodies and the governor’s office (a trifecta), signaling that state siting policies are a partisan issue. However, in states with at least one Republican legislative body, technology-agnostic siting and permitting policies were more likely to pass, suggesting that “technology inclusive” reform may have a higher chance of success in divided governments.128 Philanthropy should explore technology-inclusive siting policy strategies to better understand the potential emissions benefits of passing such reforms.
What can philanthropy do? We believe that philanthropy is well-positioned to support efforts to prevent and reverse restrictive and harmful policies. Funders can support local and state governments with technical expertise, engage conservative and unaligned constituencies, research siting dynamics, and advocate for the reversal or prevention of restrictive local ordinances.
Modernizing the Interconnection Process and Clearing the Backlog
Key ideas: Modernizing the interconnection process and clearing the backlog
1. TThe U.S. interconnection queue has become a major bottleneck for clean energy deployment. Roughly 2,600 GW of projects—mostly solar, wind, and storage—are waiting to connect to the grid, nearly double the country’s current installed capacity, with average wait times now reaching five years.
2. Administrative and regulatory systems are overwhelmed by the surge in applications. Utilities and regulators cannot process requests quickly enough, and while FERC Order 2023 has introduced a “first-ready, first-served” cluster study approach, additional solutions such as automation and streamlined review pathways are needed to clear the backlog.
3. Poor data access and unfair cost-sharing slow project development. Developers lack adequate grid data to plan feasible projects, leading to redundant or speculative applications, while current rules often require individual projects to shoulder grid upgrade costs that benefit others.
4. Outdated interconnection standards undermine grid reliability. Existing procedures were not designed for inverter-based resources like solar, wind, and batteries, creating operational risks and reinforcing the need for updated technical standards and integrated transmission planning.
To connect an energy project to the grid, developers must undergo an interconnection study process. After selecting a site and finalizing a design, a developer submits a request to an independent system operator (ISO) in regulated markets or to a utility in unregulated markets.129 Once a project developer requests an interconnection study, the project goes into the “interconnection queue” and will wait for the utility or ISO to conduct an interconnection study.130 This study examines how the project's connection may affect the reliability or safety of the grid, and assesses what new transmission or distribution upgrades may be needed to safely interconnect the project to the grid. Once the study is completed by the ISO or utility, both parties negotiate an interconnection agreement outlining the project’s operating conditions and the costs of connection (Figure 19).131

Guiding this process are interconnection procedures and technical requirements set by a regulatory authority to ensure interconnection studies and the general process meet a high standard.133 The regulatory authority in charge depends on which type of interconnection process a project requires. For larger projects that connect to the bulk power system (BPS), also referred to as transmission interconnection, the regulatory authority sits at the federal level with FERC.134 For distributed energy resource (DER) projects that are smaller than 80 megawatts (MW) in size and connect to the distribution and sub-transmission system, also referred to as DER interconnection, the regulatory authority sits at the regional level with public utility commissions (PUCs).135
Challenges with interconnection: While transmission and DER interconnection happen at different levels and are regulated differently, they face similar challenges and can be improved in similar ways.136 However, the greatest challenge to deploying large amounts of clean energy and energy storage lies at the BPS level. As a result, we discuss these issues in the context of transmission interconnection, but they can be similarly applied to DER interconnection.
The current transmission interconnection queue is backlogged and has become a limiting factor to quick clean energy buildout. As of 2023, there were roughly 2,600 gigawatts (GW) of active capacity in the interconnection queue waiting to be interconnected, which had been increasing year after year for almost a decade, as seen in Figure 20.137

Ninety-five percent of the capacity sitting in the interconnection queue is from solar, wind, and energy storage, and is almost double the current installed capacity on the U.S. energy grid.139 The current grid is not physically capable of integrating all of the resources in the interconnection queue, but many of these applications were never fully intended to reach completion.140 Project developers tend to submit multiple applications to determine which project is the lowest cost and most feasible. By submitting multiple applications, they have a greater chance that at least one project will be successful.141 Due in part to this strategy, over 70% of interconnection requests end up being withdrawn, with most historically happening earlier in the interconnection queue process.142 More recently, there has been an increase in projects being withdrawn from the interconnection queue later in the process (Figure 21).143 This growing phenomenon points to other challenges causing withdrawals, as pulling a project out of the interconnection queue later in the process is more costly for developers.144

The timeline for projects to successfully exit the interconnection queue and be connected to the grid has been steadily rising as well. For projects that were interconnected in 2023, the median time spent in the queue was roughly five years (i.e., a representative project would have entered the queue in 2018).146 Due to this growing interconnection delay, a recent study found that deployment of solar, wind, and batteries between now and 2027 will be lower than many current models have predicted.147 As a result, we believe reducing interconnection timelines is a high-priority area for philanthropic engagement.
Causes of interconnection challenges: Similar to permitting and siting, interconnection challenges are partly due to policy and regulatory challenges that have failed to keep pace with current deployment. As a result, we believe the major challenges laid out below are areas where philanthropy can help drive solutions:
- PUCs and utilities are unable to keep pace with incoming applications.148 The recent FERC Order 2023 now requires that PUCs and utilities switch from a first-come, first-served study approach to a first-ready, first-served cluster study approach.149 Further solutions to speed up the current backlog of current and future applications, such as automation strategies tied to AI or streamlined pathways for certain projects, are needed to reduce inefficiencies.150
- Project developers have inadequate access to interconnection data. With more and higher-quality data on the state of the grid, project developers will be able to plan projects and interconnection requests more effectively, accounting for the grid's capacity for growth and specific operating restrictions. As a result, developers will also be less likely to blindly submit multiple applications.151
- Grid upgrade costs are not equally distributed. As discussed earlier, after conducting an interconnection queue study, a project will receive a list of transmission upgrades needed to safely connect to the grid. The cost of these upgrades is then covered by the project developer. However, these investments in grid infrastructure may benefit other future projects. To make it easier for projects to interconnect and be more fair, there needs to be changes to how transmission upgrade costs are shared among facilities.152 Availability of transmission lines presents an additional challenge. The further a project is from a transmission line, the more expensive it will be.153 As a result, transmission and interconnection planning needs to be better integrated to ensure careful planning and intertemporal efficiency.154
- Current interconnection standards are inadequate for IBR technologies. Interconnection standards were not designed for the current fleet of IBR technologies that are sitting in the interconnection queue, such as solar, wind, and batteries.155 As a result, there have been recent IBR performance challenges caused by disturbances to the grid that were never accounted for during IBR interconnection studies.156 Standards need to be updated and modernized to interconnect new resources better and protect the grid.
What can philanthropy do? We view addressing these challenges as a critical area of engagement where philanthropy can help drive change through education, thought leadership, and government engagement. Funders can support advocacy for interconnection reform, educate state policymakers, fund research on automation and AI tools, and back thought leaders advancing smarter, more efficient interconnection mechanisms that leverage storage and grid-enhancing technologies.
Prioritizing Philanthropic Levers that Address Barriers to Clean Energy Deployment
We evaluate each sub-strategy’s scale, feasibility, and funding need. For more information on these metrics and our research process, see Giving Green’s Research Overview. We excluded funding need due to limited data on available funding. For scale, we took a qualitative approach, focusing on current bottlenecks and considering whether a lever could meaningfully address them. We assumed that addressing the most pressing bottlenecks has the greatest potential for scale, since a technology or policy that is currently constrained by a specific barrier can unlock disproportionately large emissions reductions once that barrier is removed. For feasibility, we considered political and technical factors.
Based on this exercise, we have prioritized the following approaches:
- Government engagement and policy development
- Policy modeling
- Research
- Building diverse alliances
Unlike clean firm power and other topics that Giving Green has reviewed in the past, clean energy permitting, siting, and interconnection challenges are exclusively policy and regulatory challenges. As a result, a majority of the philanthropic sub-strategies that we reviewed and prioritized are related to government engagement and policy development. Other philanthropic levers could be targeted to improve the deployment of clean energy; however, these are unrelated to the permitting, siting, or interconnection process. Instead, these levers focus on technological opportunities to improve deployment conditions or even reduce electricity demand. We may explore these adjacent levers.
Scale and feasibility of various philanthropic levers that address barriers to clean energy deployment
Streamlining and accelerating federal permitting
- Supporting government engagement and policy development
- Scale: High. Permitting is a policy challenge, meaning that to address the system's inefficiencies and prevent future delays, new policies need to be passed. Government engagement, such as Congressional education on the importance of transmission buildout and the debilitating nature of permitting challenges, is crucial to ensuring that federal policies are added to relevant policy vehicles. Additionally, policy thought leadership and development will be critical to guide final policies toward an impactful solution.
- Feasibility: Medium. While there are political windows during the 119th Congress for federal transmission reform, it is difficult to say whether they will materialize given political misalignment. There is bipartisan interest in federal permitting reform, but each party has different priorities, and it is unclear whether a middle ground can be found. However, we believe there are opportunities for philanthropy to support policy efforts and increase the likelihood that an impactful policy is passed.
- Conducting policy modeling
- Scale: High. During the policy development process, stakeholder feedback, existing studies, and modeling are typically used to inform policy design. Sometimes a policy’s impact is even modeled after its design to prove its effectiveness. Federal permitting reform, however, will most likely combine multiple policy proposals spanning several permits and processes, making it challenging to determine the combined impact of the policy package. To determine whether a permitting package is climate-positive and worth supporting, modeling will be needed.
- Feasibility: Medium. In 2024, Senators Joe Manchin and John Barrasso proposed the Energy Permitting Reform Act of 2024 (EPRA), which looked to reform permitting related to clean and fossil fuel energy. Due to the bill’s fossil fuel provisions, several environmental NGOs rallied against it. Despite these provisions, the permitting bill may have been climate positive, as some organizations claimed. However, due to a lack of trusted modeling proving so, many advocates dismissed the bill. Trusted modeling and analysis of future permitting proposals may make the difference in attaining the support needed to pass a bill.
Removing and preventing local permitting and siting roadblocks
- Supporting government engagement and policy development
- Scale: High. Similar to federal permitting, local siting and permitting issues are policy challenges that require improved policies to reverse the restrictive and harmful status quo. While state advocacy does not benefit from the broader scale of federal policy, there are many states that have political pathways for reform or large levels of potential VRE deployment.158 There are also NGO strategies that can cover several states by focusing on key projects rather than state policy. By focusing on local advocacy where there are known VRE projects planned, this strategy can lead to more direct improvements that can be replicated and reach a wider coverage.
- Feasibility: Medium. Siting and local permitting are gaining greater attention on both sides of the aisle. While climate-friendly policy may not be feasible in every state, it is possible to pass improved policies in several states and prevent extreme policies in others. The opposite is also true. There are states that are proposing harmful siting and permitting policies that can be prevented. The challenge of local siting and permitting is, however, somewhat fueled by cultural and political tensions, which can make change more difficult, especially at the local government level.
- Funding research
- Scale: High. Local siting and permitting regulations are ever-changing, and there are so many data points to track that it is difficult to know where new or growing challenges lie. As a result, ongoing research to understand the evolving local siting and permitting dynamics will help guide advocacy efforts. Additionally, we still do not fully understand how best to counter opposition to clean energy siting. Further research into successful tactics can help inform NGOs and developers on how to best advocate against restrictive policies.
- Feasibility: High. Tracking various policy efforts at the local and state levels is challenging, but not impossible. Our understanding is that with additional resources, organizations can continue to conduct these types of studies. Research into best practices, on the other hand, may run into challenges when engaging with developers who have found success, as they may be hesitant to give up their playbook for fear of losing a competitive edge.
- Building new climate grassroots networks
- Scale: Medium. While siting and permitting challenges are local, it will be challenging to build and expand climate grassroots organizations across the country that have impacts in multiple counties, let alone states. As a result, while we acknowledge the effectiveness of grassroots organizations, we believe that building new climate-oriented grassroots networks may not be the most impactful solution at this time.
- Feasibility: Low. Establishing a new, effective grassroots organization or network with strong ties to several communities takes time and is very challenging. As a result, this does not seem like a feasible approach to a very timely solution.
- Building diverse alliances across issue areas
- Scale: High. There are already many established community-based organizations that may have common ground with clean energy activists regarding restrictive siting ordinances. For example, conservative organizations that favor individual property rights may oppose restrictions on individuals' ability to install renewable energy on their land. A study has found that community-based organizations that are not climate-related can play a large role in clean energy projects for other community-related impacts.159 This is further supported by the fact that opposition against clean energy projects tends to be for reasons that impact the local community, not direct opposition to clean energy.160 As a result, we believe that partnerships between technical clean energy organizations and community-based organizations could lead to greater siting impacts by leveraging the knowledge, experience, and networks of both organizations.
- Feasibility: Non-climate-related groups engaging on clean energy issues is not a new phenomenon, and many potential local and community-based organizations across the country may have aligned interests in removing and preventing restrictive siting ordinances.161 It is not clear, however, how easy it will be to start partnerships and whether there will be a learning curve to joint advocacy. As a result, we tentatively view this strategy as having medium feasibility.
Modernizing the interconnection process and clearing the backlog
- Supporting government engagement and policy development
- Scale: High. The interconnection queue is managed by regulations set at the federal and regional levels. As a result, future regulations can mandate more efficient and effective practices that can improve the interconnection rate of renewable energy projects. By engaging with relevant government bodies, NGOs can educate regulators on existing challenges and propose new industry-informed policies to remove barriers and improve the interconnection process.
- Feasibility: Medium. The interconnection queue challenge is very apparent to regulators and is of concern. While additional engagement and policy support can lead to better policy designs, it is not clear whether they can help achieve timely changes amid lengthy regulatory processes.
Theory of Change for Philanthropic Engagement
To visualize how our prioritized philanthropic sub-strategies would interact with one another and ultimately reduce emissions, we developed a high-level TOC for addressing barriers to clean energy deployment (Figure 22). Theories of change enable us to better understand the pathways of influence, the likelihood of each pathway, and the avenues of greatest impact for philanthropic and civil society efforts.
The TOC lays out the different outputs and outcomes we would expect to remove barriers and, in turn, achieve emission reductions.

-----
63 WRI, 2025
64 See Table A. Ranges in Deployment, Total Installed Capacity, and Generation Share for Select Technologies Across the Suite of IRA-BIL Scenarios and Sensitivities. NREL, 2023
65 “Barriers to deployment, such as siting and permitting challenges, supply-chain constraints, and social acceptance of electricity infrastructure development, could significantly reduce the rate of clean electricity deployment. Evaluation of a stylized suite of concurrently-implemented deployment constraints,4 including more limited renewable resource access, constrained transmission development, and increased costs of CO2 transport and storage infrastructure demonstrated the potential for a 10 percentage point reduction in the clean generation share (relative to the Mid case) and a 24% reduction in cumulative avoided emissions 2023–2030.” NREL, 2023
66 “The outcomes we report throughout Taking Stock this year are subject to considerable uncertainty, including an incredibly dynamic policy environment and persistent non-cost barriers to clean energy deployment. These factors will continue to shape how the energy system and GHG emissions evolve in the coming years” & “renewable resources continue to face many of the same headwinds we identified last year. That interconnection queue—in which 95% of capacity is renewable— is still far too large, with years-long waits for new generators to be able to plug into the grid. In addition to federal permitting slowdowns, persistent local opposition, limited growth in transmission capacity, and inflationary pressures on installation costs all weigh on deployment” Rhodium Group, 2025
68 Small scale projects may also need a federal permit, if for example the project receives federal funding or is sited on federal land. Brookings, 2022, FERC, 2025
70 There are additional specific permitting challenges related to technologies such as nuclear and geothermal. These are covered in the clean firm section of the report and are not covered further in the proceeding sections.
71 "The large-scale increase in renewable energy production requires the operation of transmission systems with higher capacities. While renewable energy sources are often concentrated in remote areas, a significant portion of energy consumption occurs in urban areas." Basaran, 2025
72 "To meet the growing demand for electricity, improve electric service reliability and resilience, reduce consumer costs, and enable access to low-cost generation during both normal and emergency operations, there is growing recognition that additional interregional transmission capability and connectivity is necessary" DOE Grid Deployment Office, 2024
73 NREL, 2024
74 U.S. Department of Energy, Grid Deployment Office, 2024
76 ibid.
77 RMI, 2024
78 "Siting and permitting infrastructure are always challenging but even more so for a transmission project that crosses multiple states and regions. Not only is there a multitude of potential authorities with jurisdiction to issue needed permits, but each of these authorities may be required to make a separate finding of need for the project to comply with the relevant authorizing statute.” PNNL, 2025
80 ibid.
82 "For many state agencies, however, limited staffing and budgetary resources are constraints that inhibit active participation in transmission planning processes and require careful prioritization between transmission and other energy issues. In addition, because state utility regulators are required to look out for the public interest of their state, they may be reluctant to support interregional transmission solutions where benefits are shared across states in varying degrees, for fear that customers in their state would be subsidizing benefits accruing to customers in other states. This is often referred to as the ‘free rider problem,’ and it’s a consistent concern with interregional transmission projects." PNNL, 2025
83 “A single interstate transmission project may fulfill different needs or deliver different types or levels of benefits to each respective state or to the region overall. The result can be years of protracted siting and permitting proceedings, sometimes resulting in a patchwork of timebound permits along an interregional project’s route" PNNL, 2025
84 Resources for the Future, 2025
85 "A full build-out of the necessary macrogrid is also likely to require enhanced federal or regional permitting authority. Experts have long proposed siting and permitting reforms to address the mismatch between state authority over transmission line siting and the regional and national scope of the nation’s electric grid.[...] We believe that all of these reforms would be a significant improvement over the status quo. They would realign transmission-line-siting authority with both transmission-planning reforms and the need for a national macrogrid to maintain grid reliability." Klass et al, 2022
86 Resources for the Future, 2025
87 This includes planning, operational, financing, and market challenges. PNNL, 2025
89 Permits that apply to renewable energy, hydropower, geothermal, nuclear, and all types of projects: U.S. Permitting Dashboard, 2023&Brookings, 2022
91 “Energy projects” includes all forms of energy, including fossil fuels, so this number may be smaller or larger when just considering clean energy projects. McKinsey, 2025
93 Center on Regulation and Markets at Brookings, 2023
94 “Reports of 10-year or longer timelines for transmission lines are not uncommon, and both solar and wind projects face long permitting delays. Delays in these projects make it more challenging for the United States to reduce emissions to meet time-bound targets and may cause cost increases or even cancellation of a project entirely as investors and developers lose interest.” Brookings, 2022
95 Center on Regulation and Markets at Brookings, 2023
96 “We identified 32 solar, 16 wind, and 3 geothermal projects completing EIS reviews and 19 solar, 9 wind, and 13 geothermal projects completing EAs over 2010–2023.” Resources for the Future, 2025
97 Center on Regulation and Markets at Brookings, 2023
98 “Geothermal lease nominations for projects proposed on federal surface lands not managed by the BLM must receive approval from the surface land management agency (43 CFR § 3201.10(a)(2)) and complete an environmental review process under NEPA for both the surface land management agency and the BLM (generally in the form of a single NEPA review) before the BLM can conduct a lease sale.51 In practice, this period lasts 1–4 years” DOE, 2019
99 Our uncertainty lies in how many projects and gigawatts of clean energy will be subject to federal permits and whether delays will be restricted to certain technologies moving forward.
100 Federal permitting reform legislation is unlikely to be focused on one permit, and NEPA is the most politically focused on permitting reform. As a result, not focusing on NEPA will not prevent NEPA reform, and instead could lead to harmful reform rather than beneficial reform.
101 Center on Regulation and Markets at Brookings, 2023
103 Center on Regulation and Markets at Brookings, 2023&Niskanen Center, 2024&Adelman et al, 2025
104 “We observe predevelopment litigation on 28% of the projects requiring an environmental impact statement, 89% of which involve a claim of a NEPA violation. The highest litigation rate is in solar energy projects, nearly two-thirds of which are litigated. Other high-litigation sectors include pipelines (50%), transmission lines (31%), and wind energy projects (38%).” Bennon and Wilson, 2023; “In federal courts, the grounds for the challenges were based on violation of NEPA and multiple other federal statutes.” Resources for the Future, 2025
105 Institute for Progress, 2024
106 “Although the NEPA process frequently induces agencies to modify project designs or choose alternative means of achieving their goals in ways that reduce environmental damage, the process can be abused by those opposed to agency projects for reasons having nothing to do with their desire to minimize environmental harms. In such cases, project opponents deploy NEPA litigation as an obstructionist tactic” - Center on Regulation and Markets at Brookings, 2023
107 “Defendants prevailed in most cases, but a few court cases caused or contributed to the termination of three projects. Six additional projects experienced significant delays as developers waited for final court approval.”Resources for the Future, 2025; “NEPA reviews can create delays and add to the expense of clean energy infrastructure projects, and NEPA litigation has sometimes been prompted by the private interests of litigants that do not necessarily correspond to the broader public interest, suggesting that legislative reforms may be desirable” Center on Regulation and Markets at Brookings, 2023
108 “District courts generally reached a decision within one year; appellate court decisions commonly required at least two additional years.” Resources for the Future, 2025
109 Adelman et al, 2025; Center on Regulation and Markets at Brookings, 2023
110 “The U.S. Department of Energy describes renewable energy siting as a series of decision-making processes and actions that determine the location and design of new wind, solar or other clean energy generating facilities. The entities that are involved in these decisions typically issue permits listing the terms and conditions that developers must adhere to for specific projects. As a result, the term “siting and permitting” is commonly used to describe both the decisionmaking processes themselves (siting) and their outcome (a permit or permits).” Regulatory Assistance Project, 2024
111 Clean Tomorrow, 2025;Regulatory Assistance Project, 2024
112 Figure: Siting Policy Frameworks by State, Clean Tomorrow, 2025
113 “...each state’s unique political, economic, environmental, and social conditions have shaped distinctive approaches to siting. What works in Texas may not be appropriate for Vermont, highlighting the importance of tailoring siting policies to local circumstances.” Clean Tomorrow, 2025
114 “The June 2025 edition of this report finds that severe restrictions, including outright bans and de facto bans on siting renewable energy facilities, as well as controversies over individual projects, are becoming more prevalent—particularly at the local level.” Eisenson et al., 2025; Ordinances are “laws enacted by local governments, typically municipalities. Zoning ordinances allow and restrict various types of projects and may use rules and regulations known as siting standards to manage land use and regulate development and construction of solar and wind projects.” Regulatory Assistance Project, 2024
115 “The 498 contested projects include 262 projects with a solar component, 212 with a wind component, 26 with a storage component and 16 with a transmission component.” Eisenson et al., 2025
116 Sabin Center for Climate Change Law, 2025
117 “Extrapolating setbacks throughout the country can reduce wind and solar resources by up to 87% and 38% (depending on the setback size).” NREL, n.d.
118 Setback ordinance: the distance a renewable energy project can be within of another object, such as a residence or business. Center for Rural Affairs, n.d.; NREL, 2023
119 “The introduction of a slew of bills to restrict renewable deployment are most common in states that have witnessed the most wind and solar capacity additions over the last decade.5 Legislation to require more local approvals, expand restrictive setback requirements, and increase local control over zoning (see the full list on page 6) were most prevalent in Texas, Oklahoma, Illinois, New York, and Virginia.” Clean Tomorrow, 2025
120 Figure 17: See Figure 1 “The likely impact of enacted renewable energy siting legislation, by state.” Clean Tomorrow, 2025
122 See “Figure 4: The likely impact of introduced bills, by political party” Clean Tomorrow, 2025
123 “We find that it is unusual to have a project delayed, stopped, or canceled in response to only one source of opposition. As illustrated in Fig. 4, over 79 percent of our (larger set of) cases demonstrate more than one source of opposition in play. This suggests that local opposition is often multi-faceted” Susskind et al., 2022
124 Concerns regarding land value normally fall under two buckets: (1) the impact a project may have on the monetary value of private property or (2) the impact a project may have on a lands “religious, cultural, recreational to the potential use of a site for other productive purposes” like farming. Susskind et al., 2022
125 “We found that the most significant sources of opposition derived from concerns about land value (about 62 percent) and environmental impact (about 60 percent). These two affected nearly 50 percent of total generating capacity in our sample” Susskind et al., 2022
127 ibid.
128 “Siting and permitting reforms that benefit all energy technologies, including renewable and non-renewable energy technologies (also known as “all-of-the-above” or “tech-inclusive” policies), were more likely to pass in states with at least one Republican chamber.” Clean Tomorrow, 2025; Divided governments refers to states where both political parties hold control of a legislative body or governor's office.
129 Lawrence Berkeley National Laboratory, 2024&Gorman et al, 2025.
131 Valova & Brown, 2022&Lawrence Berkeley National Laboratory, 2024
132 Lawrence Berkeley National Laboratory, 2024
134 For more background information about the BPS see NARUC, n.d.
135 Slide 6, National Association of Regulatory Utility Commissioners n.d; DOE, 2025; Valova & Brown, 2022
137 Lawrence Berkeley National Laboratory, 2024
138 ibid.
139 There is 1,086 GW of solar, 1,028 GW of storage, and 366 GW of wind capacity in the grid. Current installed capacity is 1,280 GW. Lawrence Berkeley National Laboratory, 2024
140 “The current volume of queue requests vastly exceeds the physical availability of interconnections today” Gorman et al 2025.
141 “Entering multiple projects in the queue, even when the developer only plans to construct one project, creates option value as the project with the lowest assigned costs can be kept while others are eventually withdrawn from the queue at low cost. This has been long understood (see, e.g., Gergen et al., 2008). Queue squatting with ghost projects is a way to insure against unexpectedly high network upgrade costs but leads to longer queues and greater uncertainty for all other projects around their ultimate assigned costs.” - MIT Center for Energy and Environmental Policy Research
142 “The majority (>70%) of interconnection requests are withdrawn. Just 20% of requests (14% of capacity) submitted from 2000-2018 had been built as of the end of 2023” - Lawrence Berkeley National Laboratory, 2024
143 “The average duration from interconnection request to withdrawal date has edged upward in recent years” & “This trend implies that some recently withdrawn projects have waited longer in the queues before making the determination to withdraw” - Lawrence Berkeley National Laboratory, 2024
144 “Late-stage withdrawals can be more costly for developers (sunk costs, deposits) and can trigger re-studies for other projects in the queue, increasing delays.” Lawrence Berkeley National Laboratory, 2024
145 Lawrence Berkeley National Laboratory, 2024
146 “The median duration from interconnection request (IR) to commercial operations date (COD) continues to rise, approaching 5 years for projects completed in 2022-2023” - Lawrence Berkeley National Laboratory, 2024
147 “In the near term (2024–2027), our analysis projects that the annual installation rate will be below the near-term ramp up of installed capacity modeled in leading decarbonization studies” Gorman et al, 2025
148 DOE, 2024
149 The prior approach would conduct studies of projects in the order that they came in, which is what incentivized developers to submit multiple applications in slightly different locations or at different times to see if another project’s integration would lower their interconnection costs. Under FERC Order 2023, PUCs and utilities must conduct interconnection studies by grouping projects that are located near each other and that were submitted to the queue during a 45-day window. It also sets more stringent requirements for projects entering the interconnection queue. All in all, the order could lead to fewer interconnection proposals moving forward and reduce wait times late in the process, but it will not solve the interconnection queue challenge. This approach had already been implemented by some ISOs prior to the FERC Order, and while it can bring improvements, it will not solve everything. MIT Center for Energy and Environmental Policy, 2023
150 “Several incremental queue management solutions—from automation and expanded access to fast tracks to more stringent commercial readiness requirements and study timelines—may help reduce queue volumes and interconnection delays in the near term and enable transmission providers to handle larger and variable queue volumes in the longer term” DOE, 2024
151 “...there has been continued concern that inadequate access to information is contributing to high volumes of interconnection requests, high project withdrawal rates, interconnection processing delays, and an overall inequitable system. Improved access to and quality of interconnection data also support other solutions, such as interconnection study automation” DOE, 2024
152 “...having the generation facilities that prompt the network upgrades pay the entire cost of upgrades violates FERC’s “beneficiary pays” principle and likely leads to too little investment. Socializing some of these costs to all transmission grid users is a policy meriting greater consideration and is likely to be an important incentive for adding new zero-carbon generation to the grid and so contribute to national plans to green the electrical grid dramatically.” MIT Center for Energy and Environmental Policy, 2023
154 “Closer alignment in the data inputs, assumptions, and process timelines between interconnection and long-term transmission planning can help ensure that transmission solutions that would have been more efficiently identified in transmission plans are not instead triggered through the interconnection process.” DOE, 2024
155 “To ensure reliable and secure operation of newly interconnecting plants, comprehensive interconnection standards are necessary. Interconnection requirements specifying IBR capabilities and expected project performance remain a work in progress.” DOE, 2024
156 “In recent years, there has been a series of large disturbance events leading to significant IBR disconnection. These performance issues were not identified during interconnection studies of the involved plants.” DOE, 2024
157 RMI, 2024; Third Way, 2024
158 Examples of promising states are Colorado, Indiana, Louisiana, Oklahoma, Pennsylvania, and Virginia where permitting policies are likely to pass in 2026, Clean Tomorrow.
160 “We find that it is unusual to have a project delayed, stopped, or canceled in response to only one source of opposition. As illustrated in Fig. 4, over 79 percent of our (larger set of) cases demonstrate more than one source of opposition in play. This suggests that local opposition is often multi-faceted” Susskind et al., 2022
Conclusion
The U.S. stands at a pivotal moment in its energy transition. While recent policy reversals have created uncertainty about the path toward a zero-emission grid, the need for clean, reliable, and affordable electricity has never been greater. Rising demand from electrification, industrial growth, and energy-intensive technologies will require nearly doubling grid capacity by mid-century. At the same time, aging infrastructure, extreme weather, and new reliability challenges are placing unprecedented strain on the system. Meeting these challenges will require moving beyond narrow decarbonization goals toward a broader vision, one that builds a clean, cheap, and resilient energy system capable of sustaining long-term economic growth and national security.
Our vision for unleashing clean energy (UCE) in the U.S. intentionally looks beyond simply reducing emissions. It emphasizes building a modernized, resilient, and reliable grid that can meet future energy demand while enabling multiple stakeholders (governments, utilities, industry, and communities) to support and benefit from the transition. By following the strategies discussed under each pillar—commercializing and deploying clean firm power and addressing barriers to clean energy deployment—philanthropy can help shape a system-level transformation focused on unlocking stable, long-term climate success.
Looking ahead, Giving Green will issue its first UCE-aligned grants from the Giving Green Fund in 2025, marking the beginning of a wider yet targeted clean energy funding grant strategy. In 2026, we plan to expand our UCE grantmaking strategy, continue refining our prioritization process, and deepen partnerships with aligned organizations. We recommend that philanthropists similarly fund organizations working to address the challenges and barriers outlined in this report, and consider grants aligned with the strategies we have laid out.
As part of our ongoing research agenda, we also plan on exploring additional potential pillars that may warrant inclusion in future iterations of the UCE framework—such as clean technology innovation and advanced transmission technologies. These areas may similarly prove critical to unlocking system-level progress and complementing existing pillars identified in this report.
Finally, while this report focuses on the U.S., the UCE framework was designed to be adaptable to other contexts. Giving Green will consider applying this approach to other countries and regions in the future, with the goal of identifying high-impact opportunities for climate philanthropy that reflect local barriers, enablers, and opportunities for leverage.
Acknowledgments
This work has greatly benefited from the feedback provided by a variety of advisors, experts, and reviewers throughout the research process; Giving Green is grateful for those who shared their time, experience, and ideas. We would especially like to acknowledge the principal reviewer, James Hewett,162 for providing a deep review of this deep dive report during its final stages of development. All opinions remain those of Giving Green alone, and any remaining errors are our own.
-----
162 James is a Senior Manager at Breakthrough Energy
Appendix A: Nuclear Fission
Key ideas: Nuclear fission
1. Current role: Nuclear supplies about 18% of U.S. electricity and about 9% globally. In 2022, U.S. nuclear power electricity generation was about 95 GW. Models suggest the U.S. may need to add 200 GW of new nuclear power by 2050.
2. Technology types: We focus on Gen III/III+ reactors currently deployed and on Gen IV designs that promise better safety, efficiency, and lower costs.
3. Benefits: Nuclear power has low land use and has strong local economic benefits. It can also decarbonize hard-to-abate sectors like heavy industry.
4. Challenges: Nuclear power has faced high capital costs, long build times, regulatory hurdles, and difficulty competing with other electricity-generating sources. However, with additional support, we believe nuclear power can become commercially competitive and be a critical tool in decarbonizing the U.S. grid.
Background
Nuclear energy is released from the nucleus of an atom and can be harnessed to generate electricity and heat. As of 2024, nuclear power is about 18% of the U.S.’s electricity production and about 9% globally.163
In this report, we refer to both advanced large-scale light-water reactors (Gen III and III+)–which are currently being deployed–and advanced nuclear reactors (Gen IV)–which are not as developed, but promise additional safety features, fuel efficiency, and in some cases, small modular designs. We also focus on nuclear fission and not nuclear fusion because we think it will probably take at least decades before nuclear fusion reactors can generate electricity on a large scale. We believe, however, that current nuclear fission policies and market efforts should keep nuclear fusion in mind to ensure that any infrastructure established now can be used later to accelerate the commercialization of nuclear fusion. To better understand why we have not prioritized nuclear fusion, please see Appendix C.
Co-Benefits and Potential Risks
Nuclear power’s co-benefits include its low land use, low transmission buildout, and concentrated local economic benefits.164 It also has additional applications, including the potential to decarbonize other high-impact areas that Giving Green has identified, such as providing high-temperature heat to decarbonize heavy industry, supporting shipping and aviation by providing heat or electricity for hydrogen production, and powering direct air capture for carbon dioxide removal.
At the same time, nuclear power has major drawbacks that could make it less competitive relative to other options. Crucially, traditional large light-water reactors require intensive regulatory approval and have had high capital costs, cost overruns, and long construction periods.165 Given these constraints, nuclear power projects have had trouble competing against cheaper and faster-to-install alternatives, such as natural gas or VRE sources.166 Beyond cost and construction challenges, nuclear power also poses risks related to waste storage, accident potential, and the possible proliferation of nuclear materials; these concerns continue to shape public perception and policy. However, we believe that with additional support, nuclear power can become commercially competitive and be a critical tool in decarbonizing the U.S. grid.
For more information on nuclear power’s co-benefits and potential risks, please see our strategy report on supporting advanced nuclear power.
Nuclear Fission’s Future
In 2022, U.S. nuclear power electricity generation reached about 95 GW in capacity.167 Models suggest the U.S. may need about 200 GW of new nuclear power by 2050—a mid-point from these models that the U.S. Department of Energy (DOE) considers ambitious but achievable (Figure 23).168

We have several uncertainties related to philanthropy and supporting nuclear power:
- We are unsure about the viability of advanced nuclear and its technological diffusion. In particular, the future of advanced reactors depends on technological progress and political conditions, both of which are inherently uncertain. We think it is likely that nuclear power can become more cost-competitive over time because there have been systemic efforts to make it cheaper, such as a shift in focus from traditional nuclear reactors to advanced nuclear reactors, including small modular reactors (SMRs) that are designed to be smaller and lower cost to build with advanced safety features like passive cooling systems.170 At the same time, while SMRs are less customized than traditional nuclear reactors, they remain complex, which can present barriers to scaling up.171
- We are unsure whether nuclear power will be significantly reduced in cost enough to compete with other firm power resources. DOE laid out in its Nuclear Commercial Liftoff Report a list of different challenges that need to be solved for nuclear to reduce costs and be deployed more widely.172 Some of these challenges, such as financing and demand support, are covered in this report, but other nuclear-specific challenges still require attention. While it is not impossible for nuclear to reduce costs, it will be challenging, and it is not clear how competitive it will be compared to potential progress in other clean firm technologies, such as geothermal. While nuclear may never be the most cost competitive on a LCOE basis as other firm technologies, it does have other qualities and benefits that may lead it to being built. First, the potential revenue from a nuclear facility could be greater than other technologies and outweigh the higher upfront cost.173 Second, some offtakers may be willing to take a higher cost to secure a long term power purchase agreement (PPA) with stable electricity prices that other technologies may not be able to provide. Finally, the increase in firm electricity demand being driven by sources like data centers will drive demand for nuclear power.174 As a whole we believe there are several pathways that will lead to nuclear deployment, which would only grow if the cost lowers.
- We are unsure how quickly nuclear technologies developed in the U.S. will diffuse to other countries, partly because this will rely on geopolitical factors that are difficult to predict. Additionally, competition from other countries, such as China, may affect the diffusion of U.S. nuclear technology.
- We are unsure of the neglectedness of donating to nuclear power advocacy. The U.S. government has historically given more funding for nuclear power innovation compared to renewables, and this continues to be true in the current day.175 Given this history of RD&D funding, the number of policy wins nuclear power has had under the Infrastructure Investment and Jobs Act (IIJA) and IRA, and the nuclear industry’s strong lobbying presence, we think other impact areas could be more neglected and that donations could be additional elsewhere. At the same time, others have argued that philanthropy for nuclear power advocacy is neglected, calculating that only 2.5% of climate funding goes to nuclear power, or $1-2 for every $1000 donated.176 We try to address this uncertainty by supporting a variety of impact areas with our Giving Green Fund.
-----
164 Figure 3: Select elements of nuclear’s value proposition as compared to other power sources. Kozeracki et al, 2023; Additional applications: “"District heating, desalination and hydrogen production are realistic options.” Locatelli et al, 2017
165 “With large up-front costs and long lead times for projects”: IEA, accessed 2022. Regulatory costs may be more difficult to quantify. We haven’t identified an objective source for this, but anecdotally note that the “center-right” American Action Forum estimates: “The average nuclear power plant must comply with a regulatory burden of at least $8.6 million annually.” Batkins, 2016.
166 “With large up-front costs, long lead times and an often-poor record of on-time delivery, nuclear power projects have trouble in some jurisdictions competing against faster-to-install alternatives, such as natural gas or modern renewables.” IEA, accessed 2022.
167 Figure "U.S. nuclear electricity generation capacity generation, 1957-2022" U.S. Energy Information Administration, 2023
168 “Modeling results indicate need for 200+ GW of new nuclear, tripling existing capacity. Multiple system-level decarbonization modeling exercises have concluded that, especially with estimates for renewables buildout that account for limitations from transmission expansion and land use, significant new nuclear power is required by 2050.” DOE, 2024
169 See Figure 3: New nuclear capacity in a net-zero grid, based on various modeling efforts. Kozeracki et al, 2023.
170 SMRs: “Because of their size, small modular reactors (SMRs) could solve some of the major challenges of traditional nuclear power, making plants quicker and cheaper to build and safer to operate.” Crownhart, 2023. Passive systems: “To achieve the higher safety standards in terms of reduction of risk, passive systems could play an important role by eliminating the requirements of operators or external inputs for their operation. However, it may be difficult or impossible to incorporate passive systems extensively in large size reactors, but could be well fit into small and medium sized reactors.” Nayak & Sinha, 2007.
171 See Figure 1. Schematic Characterization of Different Energy Technologies Based on Their Design Complexity and Need for Customization. Malhotra and Schmidt, 2020.
172 DOE, 2024
173 See “Figure 2: 2035 Energy technology cost and revenue” ICF, 2025
174 See the section “What makes nuclear power plants attractive to data center owners?” to better understand why data centers are interested in nuclear. EIA, 2024
175 See Table 2: DOE Energy RD&D programs summary, FY 2021 enacted through FY 2024 request ($millions), Chong, 2023.
176 “According to data from ClimateWorks and our own analysis of the pro-nuclear ecosystem, only 0.1-0.2% of climate philanthropy at large supports nuclear energy’s role in climate mitigation. That means for every $1,000 in climate philanthropy, only $1-$2 goes to nuclear energy. To contextualize this number in a more intuitive way, nuclear energy receives at most 2.5% of climate philanthropy targeting clean electricity. In other words, less than $1 in every $40 for clean electricity goes to nuclear energy.” Founders Pledge, 2025.
Appendix B: Next-Generation Geothermal Systems
Key ideas: Next-generation geothermal systems
1. Current role: Geothermal currently provides less than 1% of global energy and has mostly been limited to volcanic or tectonic regions. It is possible that U.S. geothermal could expand from 2.7 GW today to 90-132 GW by 2050, with costs falling as drilling speeds and learning rates of new technologies improve.
2. Technology types: New technologies like enhanced geothermal systems, advanced geothermal systems, and superhot rock draw on technological breakthroughs in oil and gas drilling. They can unlock previously inaccessible sources of geothermal energy.
3. Benefits: Next-gen geothermal has secure supply chains, permanent local jobs, and a small land footprint. It can potentially decarbonize hard-to-abate sectors such as heavy industry.
4. Challenges: Next-gen geothermal has high upfront costs and may face community opposition due to concerns over induced seismicity. Its value to the grid is also undervalued in business models, and there is uncertainty over how quickly its costs will decline.
Background
Geothermal energy, or heat from the Earth, can be harnessed to generate electricity, provide heating or cooling, or store energy.177 Functionally, geothermal power plants can either provide consistent baseload power throughout the day or ramp electricity generation up and down to meet daily electricity supply patterns created by wind and solar.178
Currently, geothermal energy accounts for less than 1% of total global energy demand and is concentrated in countries with easily accessible and high-quality resources.179 This is largely because geothermal electricity generation is currently dominated by conventional geothermal systems, which are limited to regions with active volcanism or along tectonic plates.180
Technology improvements that borrow from U.S. oil and gas (O&G) development could open new areas for deployment and unlock previously inaccessible sources of geothermal energy.181 These next-generation geothermal technologies are less mature than conventional geothermal technologies but are reservoir-independent (Figure 24). For example, enhanced geothermal systems (EGS) use hydraulic fracturing to inject water deep underground, creating artificial reservoirs instead of relying on natural ones. Because geothermal energy potential increases as you dig deeper and hotter resources, companies are also building technologies that can drill to greater depths. Superhot rock technologies, which are on the far end of the EGS spectrum, are in the early stages of research and development (RD&D) and, if successful, could significantly increase energy extraction and conversion efficiency.182 Additionally, advanced geothermal systems (AGS) are a separate category of closed-loop geothermal wells that recirculate fluid and do not use hydraulic fracturing.183 We group EGS and AGS technologies as next-generation geothermal systems that are distinct from conventional systems.

Co-Benefits and Potential Risks
Next-generation geothermal has several value propositions, including a secure supply chain, local permanent jobs, minimal footprint, and low transmission buildout.185 Like nuclear power, next-gen geothermal has other applications, including the potential to decarbonize other impact areas that Giving Green has identified as high-impact, such as heavy industry and powering carbon dioxide removal.186 Challenges to building out next-generation geothermal include high up-front costs and risks, existing business models that undervalue its potential, and community opposition.187 Additionally, next-generation geothermal carries potential risks related to induced seismic activity and potential groundwater contamination. With additional support, we believe next-generation geothermal can become commercially cost-competitive and be deployed more widely.
For more information on co-benefits and potential risks, please see our strategy report on advancing next-generation geothermal energy.
Next-Generation Geothermal’s Future
In 2024, the U.S. had about 2.7 GW of installed geothermal energy capacity.188 Models suggest that next-generation geothermal energy can provide between 90 and 132 GW of electric power by 2050, with the potential for much more (Figure 25).189

Our primary uncertainty around next-generation geothermal rests with its future cost-competitiveness because it is inherently uncertain how quickly new technologies will improve and decrease in price. We also think there is some uncertainty about how easily skills and techniques from the O&G industry can be applied to next-generation geothermal technologies.
In general, we are optimistic about next-generation geothermal’s future because its repeatable, modular design allows each new well to improve upon the last. This “learning rate” is key to driving down the cost of next-generation geothermal systems. Early reports from Fervo demonstrate a 300 percent increase in drilling rate, leading to drilling costs decreasing from an initial $9.5 million to $4.8 million over six wells in six months, and drilling timelines at U.S. Department of Energy (DOE) Frontier Observatory for Research in Geothermal Energy (FORGE) demonstration sites are approaching standard O&G rates (Figure 26).191 At the same time, FORGE is a well-studied site, and our understanding is that learning rates may be slower in areas with less well-understood or physically harder geology.

-----
177 “Geothermal energy systems harness this heat from the subsurface and transport it to the surface, where it can be used for heating and cooling, electricity generation and energy storage.” IEA, 2024
178 “An increasing need for flexible generation is driving geothermal operators to investigate operational practices that allow geothermal plants to bank energy in the subsurface during times when electricity supply is plentiful and prices are low, and release that excess energy during times when supply is low and prices are high.” DOE, 2025
179 “For the moment, geothermal meets less than 1% of global energy demand and its use is concentrated in a few countries with easily accessible and high-quality resources, including the United States, Iceland, Indonesia, Türkiye, Kenya and Italy.” IEA, 2024
180 Electricity: “CHS comprises nearly all geothermal electrical power generation existing today.” University of Texas, Austin, 2023. Extent of CHS: ““While the technology is mature, it is limited in supply globally as locations with sufficient heat and fluid flows for power generation are largely confined to areas with active basaltic volcanism, or continental plate boundaries.” University of Texas, Austin, 2023
181 “Advances in technology are opening new horizons for geothermal, promising to make it an attractive option for countries and companies all around the world. These techniques include horizontal drilling and hydraulic fracturing honed through oil and gas developments in North America.” IEA, 2024
182 “At extremely high heat, the performance of geothermal doesn’t just rise, it takes a leap. When water exceeds 373°C and 220 bars of pressure, it becomes “supercritical,” a new phase that is neither liquid nor gas… For our purposes, there are two important things about supercritical water. First, its enthalpy is much higher than water or steam, meaning it holds anywhere from 4 to 10 times more energy per unit mass. And second, it is so hot that it almost doubles the Carnot efficiency of its conversion to electricity.” Vox, 2020
183 “Advanced Geothermal Systems (AGS) generate heat and/or electric power through a closed-loop circuit, after a working fluid, such as water or CO2, extracts thermal energy from rock formations at great depths via conductive heat transfer from the geologic formation to the working fluid in the closed loop through an impermeable zone, such as a pipe wall.” Malek et al. 2021.
184 Executive Summary Figure 1: Geothermal technology overview across conventional (left) and next-generation (right) designs. DOE, 2025
185 “Geothermal energy can be used to either generate electricity or can be used directly as heat… Geothermal technologies require some of the smallest land area per kilowatt of any energy technology, firm or renewable.33 Next-generation geothermal can also scale supported by the availability of workers with translatable skillsets, many from the oil & gas sector.” DOE, 2025
186 Heavy industry: “Geothermal heat can be used directly in several currently hard-to-decarbonize applications, including process heat for industrial applications. Process heat represents over half the emissions from the industrial sector, and geothermal energy is well-suited to help mitigate the half of those emissions caused by low- and mid-temperature applications.” DOE, 2025 Hydrogen production: “Geothermal direct use heat can also be directly leveraged for hydrogen production at temperatures above 150C.” DOE, 2025
187 See “Table 2: Challenges confronting the pathway to commercial scale for next-generation geothermal liftoff and potential solutions as determined from analysis and interviews.” DOE, 2025
188 See United States. IRENA, 2025, processed by Our World in Data
189 “Next-generation geothermal energy can provide 90-132 GW of electric power to a fully decarbonized grid by 2050, with the potential for significantly more.” DOE, 2025
190 See Figure 7 in linked report: “Projected cumulative deployment of next-generation geothermal power until 2050 [left axis] and added capacity in two-year increments [right axis]” DOE, 2025
191 “The private sector has shown how these drilling rate improvements translate to massive cost reductions: recent reports from Fervo’s earliest deployments demonstrated a 300 percent increase in drilling rate in the process resulting in drilling costs decreasing from an initial of $9.5 million to $4.8 million over six wells in 6 months.” DOE, 2025
192 See Figure 10 in the linked report: Drilling rate improvements in early next-generation geothermal demonstrations. DOE, 2025
Appendix C: Other Clean Firm Technologies
We are most interested in directly supporting the commercialization of nuclear fission and next-generation geothermal technologies based on our assessment of their scale, feasibility, and funding need. More broadly, however, we would like to remove general barriers to the deployment of other clean firm power sources, given the benefits those technologies will bring to the grid and to sustaining deep decarbonization. While Giving Green may not focus on other clean firm technology challenges at the moment, this does not preclude us from working on them in the future. Below is a description of the other clean firm technologies and why we are not currently focusing on them.
Long-Duration Energy Storage (LDES)
LDES refers to a collection of different technologies that can store and discharge energy over a minimum duration of 10 hours.193 There are roughly three classes of LDES: inter-day LDES, which has a duration between 10 and 36 hours; multi-day/week LDES, which has a duration between 36 and 160+ hours; and seasonal LDES, which has a duration of months.194 LDES technologies also vary in technological maturity and mechanism of storing energy (e.g., mechanical, electrochemical, thermal).195 According to a U.S. DOE report, “the U.S. grid may need 225-460 GW of LDES capacity for power market application for a net zero economy by 2050.”196
In 2025, we are not focused on LDES because we are not confident that there is a need for technology-specific approaches or that general clean firm philanthropic efforts are sufficient to advance the commercialization and deployment of LDES technologies. Additionally, we believe there are fewer opportunities to make progress at the federal level, given the Trump Administration's opposition to renewable energy, which is crucial to the deployment of LDES. There may be more opportunities at the regional and state level that warrant additional philanthropic support, but this is not yet clear to us.
Overall, LDES is something we would like to continue exploring and potentially reconsider prioritizing in the near future.
Nuclear Fusion
Nuclear fusion is the process by which two atomic nuclei combine and form a single heavier one, releasing massive amounts of energy.197 This process powers the sun and other stars. We have not prioritized nuclear fusion because it is still in the early stages of RD&D. For our purposes, we believe its future as a cost-effective source of energy is too far down the road and uncertain. In case nuclear fusion does take off, though, we believe that policies focused on nuclear fission should also leave room to support nuclear fusion technologies.
Natural Gas and Carbon Capture, Utilization, and Sequestration (CCUS)
CCUS technologies can cut emissions from hard-to-abate sectors, such as heavy industry, aviation, and maritime shipping. In general, we think CCUS could be a valuable technology in those contexts as well as in emerging economies, where it could be an important tool for decarbonizing existing and new fossil fuel facilities, because it is unlikely that new investments will be dropped soon. However, we have some concerns about supporting CCUS technologies. For example, incentives for power sector CCUS and captured CO2 storage via enhanced oil recovery could extend the use of fossil fuels.198 Given the strong incentives included under the 45Q tax credit for sequestering carbon oxides, we would like to assess whether CCUS needs more support and what role it should play in decarbonization.
Hydropower
Our understanding is that building out new hydropower in the form of large dams on existing waterways is most likely unfeasible due to high costs. There has also been a relatively steady number of dam license surrenders and terminations over the past decade.199 We also have some concerns about climate change’s effects on hydropower’s operability. For instance, although it is expected that mean annual hydropower will increase in the U.S. under future warming, these increases will vary regionally and seasonally.200 Some regions also face an increased risk of droughts, which will impact hydropower output, while others face increased rainfall that will strain older dams.201 It seems likely that these changes could threaten dam safety and long-term viability.
While we think it is unlikely that the U.S. would build new large dams, we think there could be opportunities to tap energy from non-powered dams that are currently used for water management or navigational purposes.202 However, we have not prioritized this strategy because hydropower is mature and commercially viable; therefore, we believe it is less in need of philanthropic support compared to other technologies. We think there could still be potential for building out hydropower in other countries, but we have not explored this in depth.
-----
193 “In the energy and academic communities, there is an emerging consensus that ‘‘long’’ means at least 10 h of duration for LDES.” Twitchell, DeSomber, & Bhatnagar, 2023
194 DOE, 2023
195 For an overview of different mechanisms of storing energy, we recommend “Long-duration energy storage technology adoption: Insights from U.S. energy industry experts.” Selänniemi, Hellström, and Björklund-Sänkiahoom, 2025
196 DOE, 2023
197 “Nuclear fusion is the process by which two light atomic nuclei combine to form a single heavier one while releasing massive amounts of energy.” IAEA, n.d.
198 “Project Tundra, which has already received substantial funding from the DOE — and which the current assistant secretary for fossil energy and carbon management advocated for prior to joining the federal government — is a proposal to put carbon capture on a coal plant that has reached its end of life, which would likely extend operations into the 2040s. My analysis suggests that adding CCS could be worth $5-6 billion for this power plant, while increasing emissions by 6 to 8 million tonnes of CO2-equivalent relative to closing the plant at its end of life.” Utility Dive, 2023
199 See Figure 8 in linked report. License surrender activity trends by milestone and project type (2010-2022). DOE, 2023
200 “We find that the median projected changes in annual hydropower generation are typically positive—approximately 5% in the near-term, and 10% in the mid-term. However, since the risk of regional droughts is also projected to increase, future planning cannot overly rely on the ensemble median, as the potential of severe hydropower reductions could be overlooked.” Broman et al, 2024
201 “Aging infrastructure and more frequent and intense rain events cause additional strain to the nation’s dams.” ASCE's 2025 Infrastructure Report Card, 2025
202 “According to EIA’s most recent electric generator inventory, 32 dams that currently do not generate electricity are planned to be converted to hydroelectric dams, which will add more than 330 megawatts (MW) of electric generating capacity to the grid over the next several years. The United States has more than 90,000 dams, but only 3% of those currently support hydroelectric generators. Those generators have a total hydroelectric capacity of nearly 80,000 MW as of February 2019. Other dams are used solely for water management or navigational purposes and are referred to as nonpowered dams (NPDs). Although many NPDs lack the hydrological attributes to support electric power generation, a 2012 U.S Department of Energy report estimated that NPDs have 12,000 MW of potential capacity that could be used to increase U.S. hydroelectric generation.” EIA, 2019
Appendix D: Examples of State Permitting and Siting Variations
Some common differentiating factors between state approaches to permitting and siting are:203
- Different state entities are involved in the siting process: In roughly half of U.S. states (26), the state entity involved in siting is the utility commission. However, 25% of states (13) have a specific agency dedicated to siting, 18% have a general agency such as a department of environment, and three have no state involvement.
- States use different forms of contingent thresholds: States will use different thresholds to decide whether a local government or state government will site a clean energy project. For example, some states will use a project's megawatt (MW) capacity to determine who has authority, while others will also consider the height of a wind turbine or the acreage of a solar farm.
- Siting and permitting timeline requirements vary across states: 31 states require that a project site permit be accepted or rejected within a given period after the start of the siting process. Some timelines require action within 30 days, while others can take up to a year.
- Public engagement is not always required: Only 34 states require a public engagement process, such as a public meeting, during the siting and permitting of clean energy projects. States that do not include this requirement tend to leave this up to local governments.
- Some states set standards via model ordinances: Some states provide an example ordinance for a clean energy technology that local governments can use as they develop their siting standards. In total, 15 states have a model ordinance for solar and wind projects, 12 states have a model ordinance just for solar projects, and 3 states have a model ordinance just for wind projects.
This level of variety is what makes the U.S. clean energy siting landscape so complicated; however, it is also what allows local communities to ensure their unique and specific needs are met.
-----
Support Our Work
Giving Green Fund
One fund. Global impact. One hundred percent of your gift supports a portfolio of high-impact climate organizations, vetted by our research.
Best for:
Donors who want the simplest way to impact multiple climate solutions.
Top Climate Nonprofits
Meet the organizations on Giving Green’s list of high-impact nonprofits working to decarbonize our future, identified through our rigorous research.
Best for:
Donors who want to give directly and independently.
Support Our Work
We thoroughly research climate initiatives so you can give with confidence. For every $1 we receive, our work unlocks another $25.90 for effective climate solutions.
Best for:
Donors who want to amplify their impact through research.
.png)

.png)
.png)


.png)


.png)
.png)


.png)
.png)

.png)
.png)

.png)
.png)


.png)
.png)

.png)


.png)
.png)
.png)

.png)
.png)
.png)


.png)


.png)
.png)


.png)


.png)


.png)


.png)

.png)


.png)