Supporting a Clean Energy Transition in LMICs: Strategy Report
Summary
Why did we decide to focus on Low- and Middle-Income Countries?
Emissions are increasing quickly in emerging economies, and we think it is important to understand the challenges and opportunities for low-carbon and cost-effective pathways to meet growing energy demand of Low- and Middle-Income Countries (LMICs). We try to take a nuanced approach that also considers the moral imperative of High-Income Countries (HICs) leading on emissions reduction and embedding LMICs’ energy transition into a broader context of energy access, energy security, and economic growth.
Why did we select India and Indonesia as our focus countries?
We selected India and Indonesia primarily due to their high level of current and projected CO2 emissions. Both countries present opportunities for nonprofits to influence policy and could drive significant reductions in the global carbon budget.
Why did we narrow down on the electricity sector?
Electricity and heating are responsible for over 40% of total CO2 emissions in Indonesia and over 50% of total CO2 emissions in India. The electricity sector plays a central role in the clean energy transition due to its high emissions and its prioritization on the political agenda. While this document focuses primarily on the electricity sector, we have also considered strategies that include reducing emissions from LMICs across other sectors, such as industry, in our sector-specific strategy reports.
Nonprofits' strategies in a clean energy transition:
Nonprofits in India and Indonesia advance the clean energy transition via research, government and policy engagement, mobilizing finance, community-level capacity building, implementation, and grassroots initiatives. Based on our analysis, we think research and knowledge creation, government and policy engagement, and mobilizing finance could be especially promising for high cost-effectiveness. We believe reputable think tanks have a large scope to influence national and sub-national energy transition policies by conducting reliable research, cultivating government partnerships, and acting as advisory bodies.
Theory of change:
Government and policy engagement as well as research and knowledge creation, can increase political support and capacity to implement ambitious electricity policies. Mobilized finance can also help make clean energy projects bankable. Combined, these can result in increased implementation of clean energy projects, leading to efficiencies that can reduce costs. Subsequently, higher adoption of renewable and energy-efficient technologies would reduce greenhouse gas emissions.
What are the key uncertainties and open questions?
We are unsure to what extent nonprofits working in the energy transition space in India and Indonesia can influence policy and how resistant this is to changes in government. Although we relied heavily on local experts and funders in our research, we recognize that our understanding of the nonprofit landscape is most likely incomplete.
What is the bottom line and what are the next steps?
We believe supporting research and government and policy engagement, as well as mobilizing finance, is promising in India and Indonesia. We think that organizations promoting these strategies could advance more ambitious electricity policies in India and Indonesia. We are considering funding organizations working on these strategies.
This report was last updated in November 2025. This is a non-partisan analysis (study or research) and is provided for educational purposes.
Questions and comments are welcome at hello@givinggreen.earth.
Cover image: Energy Transition. Pixabay.
Why Are We Focusing on a Clean Energy Transition in Low- and Middle-Income Countries?
Why are We Focusing on Low- and Middle-Income Countries?
Giving Green’s mission is to improve human and ecological wellbeing. We aim to increase funding for high-impact strategies that reduce greenhouse gas (GHG) emissions, thereby mitigating the negative effects of climate change on people and the planet. We recognize that climate change is a global issue requiring a global response; hence we adopt an international approach to identifying and promoting the most high-leverage and cost-effective mitigation strategies worldwide.
Overall, we think it is important to address emissions in both High-Income Countries (HICs) and Low- and Middle Income Countries (LMICs). We take a nuanced approach that considers their respective emissions trajectories in addition to the moral imperative for HICs to lead on emissions reduction and the need to position decarbonization in LMICs in the broader context of energy access, energy security, and economic growth.
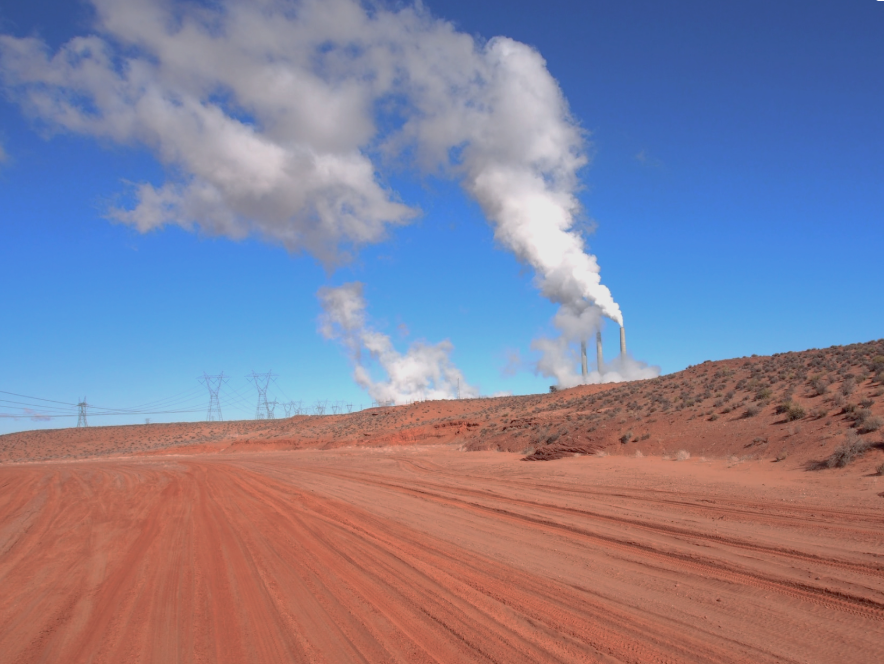
Emissions trajectories in HICs and LMICs. High-Income Countries (HICs) hold a central role in depleting the global carbon budget.1 HICs are responsible for 57% of global cumulative emissions, amounting to 1 trillion tons.2 In 2022, emissions per capita averaged 10.1 tons in HICs in contrast to 0.3 tons in Low-Income Countries (LICs).3 In simpler terms, on average, a single person in an HIC emits more than 30 times as much as an individual in an LIC.4 Due to the high emission levels, we think there is significant scope for reducing emissions in HICs. Additionally, mitigation strategies in HICs can be particularly cost-effective, especially when emission levels are high.5
Given the historical and current emission levels, we acknowledge the moral imperative of HICs to lead the way in greenhouse gas emission reductions. In parallel, we recognize that this alone may not be sufficient. Low- and Middle-Income Countries (LMICs) play an important role in ensuring that we do not surpass the 1.5-degree target.6 LMICs, when excluding China, are expected to account for the majority of the world’s annual greenhouse gas emissions by 2040.7 We think the role of LMICs is especially paramount given the rate of increasing emissions in these regions (Figure 1).8

Emissions and economic growth. The rise in emissions in LMICs has closely followed their economic and demographic growth trajectories.10 As these economies continue to grow, their carbon emissions are expected to increase further.11 Rising incomes in MICs were associated with an increased demand for consumer durables, thereby boosting electricity and energy consumption.12 For instance, doubling personal real income increased the probability of an individual owning a vehicle by 9.6%, with similar trends observed in the ownership of air conditioners, refrigerators, or cell phones.13 Further, emissions in LMICs are expected to rise with a growing demand for transportation services.14 Hence, as LMICs continue to develop economically, decarbonization efforts will be central to mitigating a steep increase in emissions.
Cost-effectiveness of mitigation strategies. Even though, as acknowledged earlier, climate change mitigation strategies may be more cost-effective when emissions are higher, we think certain strategies may be cheaper in LMICs. For example, inputs such as land or labor may be more cost-effective, leading to an overall lower cost of implementation in LMICs compared to HICs.15 We think many cost-effective low-carbon strategies that remain untapped in LMICs could bring in more development opportunities. These untapped opportunities are often referred to as "low-hanging fruit" because they may be relatively easy to implement and have the potential to substantially reduce emissions.16 Nevertheless, we acknowledge that not all “untapped opportunities” are desirable or feasible to implement. We note that in certain scenarios, environmental policies may conflict with economic growth efforts, as they may impose additional costs and risks or negatively influence innovation, productivity, or profits.17
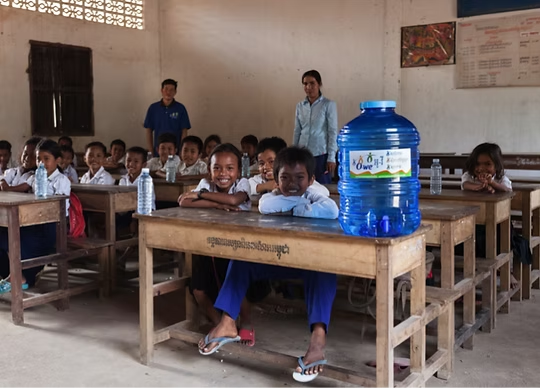
We believe that decarbonization in LMICs needs to be positioned in the broader context of expanding access to energy and guaranteeing energy security and basic services without hindering economic growth. We are interested in exploring climate change mitigation strategies to reduce emissions in LMICs while keeping economic and developmental priorities in mind.
Why Did We Prioritize India and Indonesia?
Given the small size of the research team at Giving Green and our limited bandwidth, we had to make difficult decisions and select priority countries. We followed a step-by-step approach to identify high-priority countries and assign them to three priority tiers, as described below.
We first compiled a comprehensive list of LMICs using the most recent World Bank Atlas categorization, filtering out all countries categorized as “High income.” This step yielded 131 LMICs18, from which we aimed to identify up to 10 for further consideration.
Motivated by our Scale, Feasibility, and Funding Need framework, we identified suitable data to inform a list of criteria for country prioritization, which we describe below and present in our Country Prioritization spreadsheet.
- Scale: To assess scale, we gathered country-level data on current emissions and per capita emissions, as well as projected 2050 emissions.19 We used two selection criteria for evaluating scale: one centered on overall emissions, and one that places greater weight on emissions per capita. The former reflects the influence that national governments may have on overall emissions trajectories through national policy, while the latter acknowledges that more targeted sector-level or microeconomic interventions may be promising in countries with high per capita emissions, provided that a country has relatively high overall emissions.
- Selection criteria 1: We first narrowed our list to countries with current emissions in the top 25% among LMICs. Then we selected the countries whose projected absolute emissions in 2050 under a business-as-usual (BAU) scenario are in the top 25% of this subset.20
- Countries that passed Scale selection criteria 1: Brazil, China, India, Indonesia, Iran, Mexico, Pakistan, Turkey, Vietnam
- Selection criteria 2: We first selected LMICs that ranked in the top 50% of total emitters and the top 25% of per capita emitters. From this subset, we then further selected countries whose projected 2050 BAU emissions are in the top 50%.
- Countries that passed Scale selection criteria 2: China, Iran, Malaysia, Mexico, South Africa, Thailand, Turkey, Vietnam
- Selection criteria 1: We first narrowed our list to countries with current emissions in the top 25% among LMICs. Then we selected the countries whose projected absolute emissions in 2050 under a business-as-usual (BAU) scenario are in the top 25% of this subset.20
- Feasibility: We then excluded countries with presumed low feasibility based on the Global Philanthropy Environment Index (GPEI).21 We excluded countries with an “Overall” GPEI score below 3 out of 5, resulting in outcomes that roughly aligned with our own assessments of our ability to conduct due diligence (in part due to language barriers) and to direct funding to organizations in these countries effectively.
- Countries that also passed the Feasibility criterion: Brazil, India, Indonesia, Malaysia (missing data), Mexico, Pakistan, South Africa, Thailand
- Funding need assessment: The existence of and approach to assessing funding need estimates is highly variable.22 We crudely assessed funding need by estimating the combined public, private, and philanthropic sector climate funding as a percentage of overall funding need. We did so by first identifying relatively recent estimates23 of climate funding and overall need from Climate Policy Initiative and other sources, as well as climate philanthropic funding from ClimateWorks.24 We then divided total climate funding by funding need. However, the lack of a common data source within and across countries makes us cautious about over-interpreting this data, which we interpret as indicating that none of the countries in the list above are more than halfway to meeting their annual climate funding needs.
Given our team’s limited size and resources, we created prioritization tiers for the remaining countries.25 For our highest priority countries (Tier 1), we planned to pursue active country-specific research and outreach, while for countries in Tier 2 we would begin more passively gathering further information to consider expanding our Tier 1 list in the future. For countries in Tier 3, we planned to consider promising funding opportunities that came across our radar. Country tiers and sources for the country-level information below can be found in our Country Prioritization spreadsheet.

In Tier 1, we prioritized India and Indonesia due to these countries’ exceedingly high emissions. Both are among the top ten global emitters, and each includes sectors with projected 2050 emissions that exceed the current emissions of any other country on our shortlist.
- India: With emissions totaling over 3 billion MtCO2 in 2023, India is the third-largest global emitter (excluding land use change), behind China and the United States, and has the highest emissions among LMICs deemed feasible for philanthropic influence. Under BAU, the most emitting sector in 2050 is expected to be energy, emitting 4.3 GtCO2, followed by industry (2.6 GtCO2) and transport (1.1 GtCO2). Climate Policy Initiative estimates that India’s annual funding need to achieve its NDC is $170 billion, while its current yearly funding is around $50 billion, indicating an annual shortfall of around $120 billion.
- Indonesia: Indonesia emitted 733 MtCO2 in 2023, making it the eighth-highest emitter globally (excluding land use change) and the second-highest emissions among LMICs we deemed feasible for philanthropic influence. Under BAU, the most emitting sector in 2050 is expected to be energy, emitting 1.9 GtCO2, followed by agriculture (863 MtCO2) and industry (448 MtCO2). We estimate with low certainty that annual climate funding in Indonesia totals around $10-15 billion, while CPI’s bottom-up climate finance need data suggests a yearly need of $47 billion, indicating an annual shortfall of around $35 billion.
In Tier 2, we will continue to explore Mexico and South Africa, given their relatively high emissions and emissions per capita among LMICs:
- Mexico: Mexico emitted 483 MtCO2 in 2023 (on par with Brazil’s 486 MtCO2), making it the 13th highest global emitter (excluding land use change). Mexico is the only country to pass both of our scale criteria, indicating that it has both relatively high overall and per capita emissions. Under BAU, the most emitting sector in 2050 is expected to be industry, with emissions of 468 MtCO2. We estimate with low certainty that annual climate funding in Mexico totals around $2-4 billion, while CPI’s bottom-up climate finance need data suggests a yearly need of $17 billion, indicating an annual shortfall of around $13 billion.
- South Africa: South Africa emitted 402 MtCO2 in 2023, making it the 15th-highest global emitter (excluding land use change). It has the second-highest per capita emissions among countries that passed our scale and feasibility criteria (behind Malaysia) at 6.4 MtCO2 per person in 2023. Under BAU, the most emitting sector in 2050 is expected to be energy, with emissions of 311.6 MtCO2. Climate Policy Initiative estimates that South Africa’s annual funding need to achieve its net-zero goal by 2050 is $31 billion, while its current yearly funding is around $6 billion, indicating an annual shortfall of around $25 billion.
As for Tier 3, Brazil, Malaysia, Pakistan, and Thailand remain of particular interest, particularly in the sectors that are on track to have the most emissions by 2050 (agriculture in Brazil, energy in Malaysia, agriculture or industry in Pakistan, and industry in Thailand). Given that we have previously prioritized emissions from food systems and industry, we may favor opportunities in these countries in our other Giving Green philanthropic strategies.
Data Limitations
- Several sources either lack complete data on all countries or do not make data publicly available, so we exclude data for several countries that do not meet our early inclusion criteria. For example, we use data from World Data Lab to identify countries with high business-as-usual emissions in 2050, though given that the data required manual entry, we only entered data for countries in the top 50% of current LMIC emitters, which did not preclude this analysis but may prevent additional useful approaches to slicing the data.
- We lack data on the available climate finance and funding need for many countries, and the data we managed to identify for countries that stand out based on our “scale” assessment comes from multiple sources that may use different approaches. For instance, we used funding need data from CPI’s Bottom-up Climate Finance Needs dataset—which collates climate finance needs data from countries’ NDCs and other official documentation—for several countries, while we used other CPI data for countries where bottom-up data is not available or leads to misleading conclusions. Even if we had this bottom-up data for all countries in our dataset, countries use different approaches to estimate their climate finance needs.27 The lack of a globally accepted definition of climate finance needs therefore weakens our assessment.28
Why Did We Focus on the Electricity Sector?
We would like to support systems change interventions spanning diverse climate impact areas in India and Indonesia. As part of our research process, we completed an assessment of the most promising impact areas for the Giving Green Fund in 2024. Per our assessment, we are open to advancing India’s and Indonesia’s nonprofits working towards industrial decarbonization, decreasing livestock emissions, carbon removal, nuclear power, geothermal power, or solar geoengineering governance and coordination.
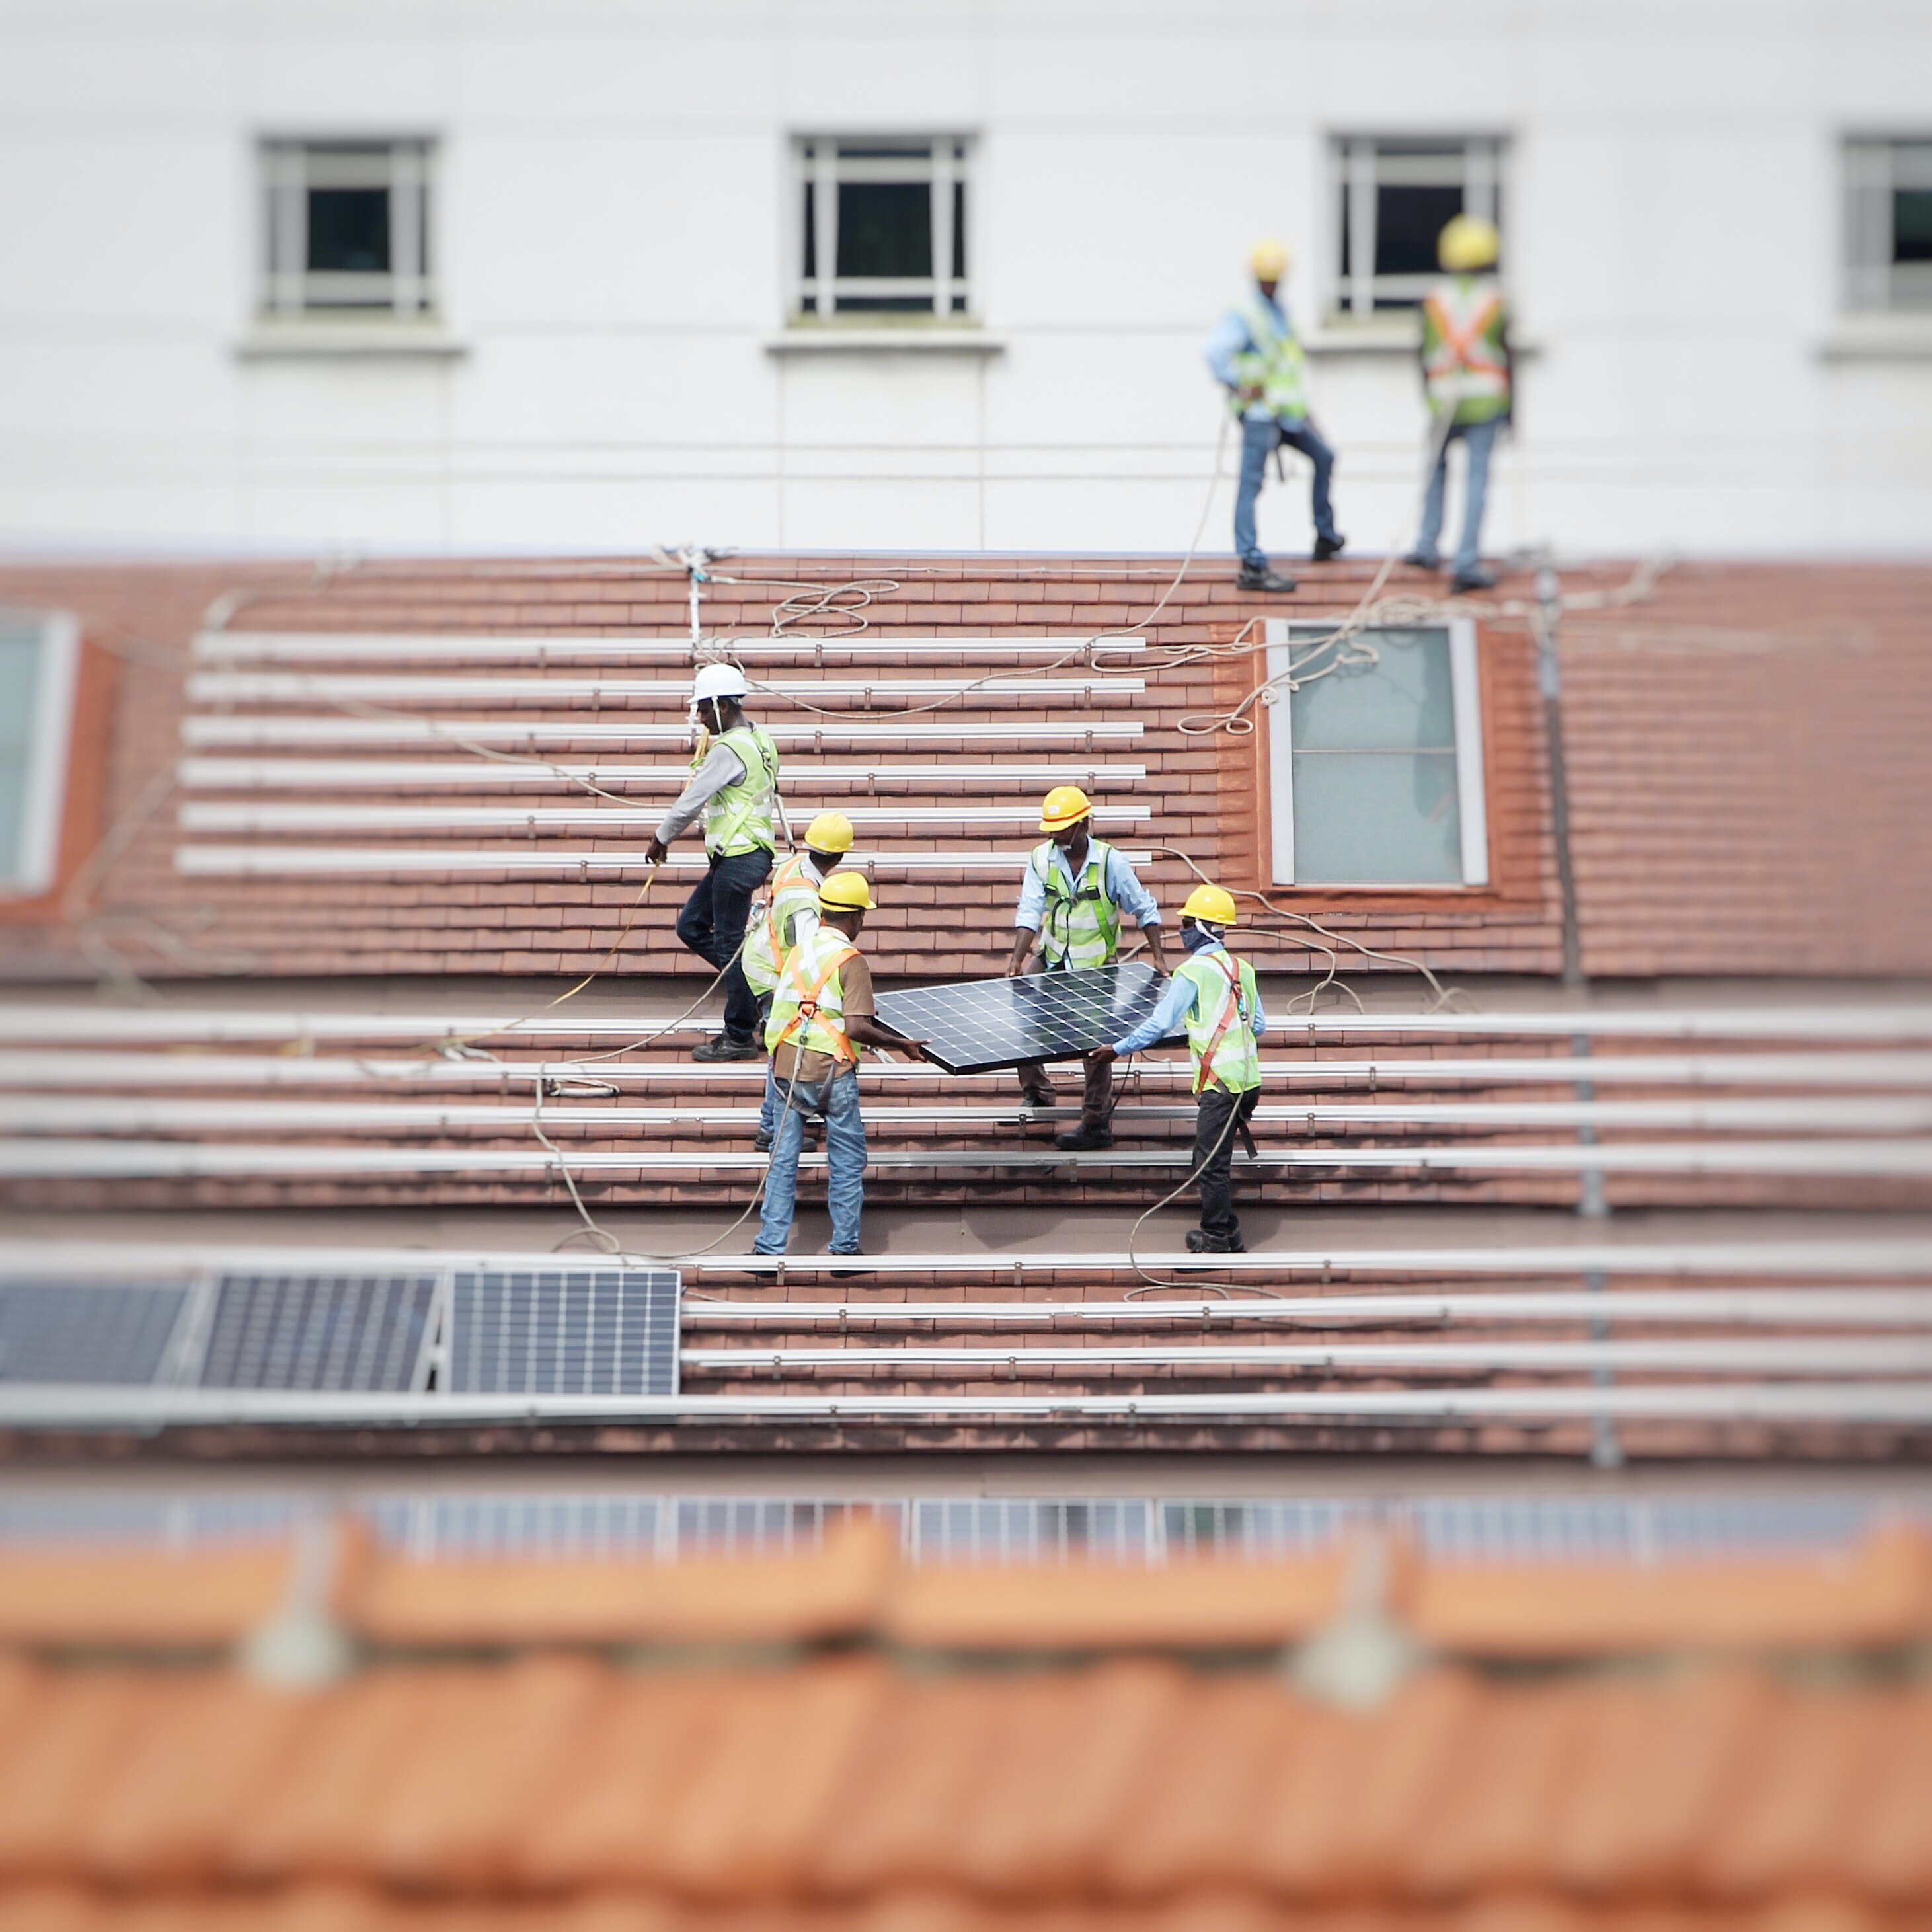
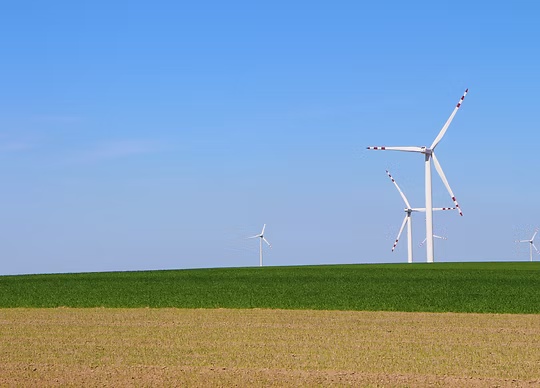
Alongside the Giving Green global priorities, we decided to focus on the electricity sector in India and Indonesia due to its significant impact on emissions and its potential for a high-impact role in the clean energy transition. By clean energy transition, we are referring to replacing high-carbon fossil fuels with low-carbon clean energy, mainly consisting of renewable energy sources, such as solar, wind, or hydropower.29
As of 2021, electricity and heat production were the key sources of emissions in both India and Indonesia. In India, the electricity and heat production sector accounted for 51.2% of total CO2 emissions, followed by industry, transport, and residential emissions (Figure 2).

Similarly, in Indonesia, the largest source of emissions is electricity and heat producers at 43.2%, followed by industry, transport and residential emissions (Figure 3).

Given that the electricity and heat-producing sector is the main emitter in India and Indonesia, we wanted to understand whether emissions mitigation in this sector is feasible to support. This includes assessing whether it is a government priority, whether nonprofits working in space could be influential at the policy level, and whether philanthropic funding could be impactful.
The Opportunity to Decarbonize the Electricity Sector in India
In India, the government has outlined an ambitious climate action plan, Panchamrit, which includes targets such as reaching 500 GW of non-fossil-fuel energy capacity by 2030 and achieving net-zero emissions by 2070.32 Between 2015 and 2022, India issued the highest number of climate policies among all countries: over 50 policies, ranging from production-linked incentive schemes to policies promoting solar panels.33 As of 2024, India had the 4th largest renewable energy installed capacity worldwide.34 The Indian government has implemented policies to accelerate the electricity transition, such as transmission projects to transport renewable energy or new regulations to improve clean energy integration in the electricity grid.35
Some of India’s other priorities compete with mitigation. Namely, while substantial progress has been made in increasing renewable energy, coal plays an important role in energy security,36 and 2023 was a record-high year in the amount of domestic coal production and coal imports.37 Further, there are plans to add new coal capacity in the upcoming years.38 The pace of the electricity transition is also uneven among states.39
We acknowledge that the clean energy transition is a priority for the Indian government. To that end, we think nonprofits can play a crucial role in collaborating with the government to find low-carbon pathways to advancing energy security. Our qualitative scoping with philanthropies revealed funding gaps in the energy ecosystem, particularly in research and knowledge creation, indicating that organizations could benefit from additional catalytic funding.40 However, we do acknowledge that we may be reflecting a bias of international funders by focusing on the electricity sector over other underfunded and under-prioritized efforts, such as adaptation or conservation (see “Key uncertainties and open questions”).
The Opportunity to Decarbonize the Electricity Sector in Indonesia
In Indonesia, the government has committed to achieving net zero by 2060 and has plans to retire coal power plants, although these plans are conditional on international financial support.41 Indonesia has not curated a coal phase-out roadmap, the 2021-2030 National Electricity Plan continues to rely on coal power, and its ban on coal exports has been lifted.42 Despite these challenges, the Just Energy Transition Partnership (JETP) Secretariat, a government initiative, provides an opportunity for nonprofits to influence policies, support the dissemination of off-grid renewables in remote areas, and increase community participation.43 Our understanding is that the JETP Secretariat is of a collaborative nature and routinely holds consultations with civil society groups and trade unions.44 We think that nonprofits could leverage their expertise to increase community participation and help shape the political agenda.
Both the Indian and Indonesian governments prioritize electricity transition, and there are specific areas where nonprofits can make significant contributions.45 By focusing on the electricity sector, we aim to address the largest source of emissions in both countries and leverage the potential for impactful action through collaboration with governments and other key stakeholders, such as academia, utilities, renewable energy companies, and industry alliances.
---
1Note: We adopted the World Bank Atlas method to classify countries based on their income level as High-Income Countries (e.g. Belgium, Chile, Saudi Arabia), Upper-Middle Income Countries (e.g. Botswana, Ecuador, Serbia), Lower-Middle Income Countries (e.g. Haiti, Nepal, Senegal) and Low-Income Countries (e.g. Chad, Rwanda, Yemen). (World Bank Group, 2024); Income-level categorization: “For the current 2025 fiscal year, low-income economies are defined as those with a GNI per capita, calculated using the World Bank Atlas method, of $1,145 or less in 2023; lower middle-income economies are those with a GNI per capita between $1,146 and $4,515; upper middle-income economies are those with a GNI per capita between $4,516 and $14,005; high-income economies are those with more than a GNI per capita of $14,005. Table: BY INCOME.” (World Bank Group, 2024)
2“Chart: Share of global cumulative CO₂ emissions” (Our World in Data, 2022)
3“Per capita CO2 emissions, 2022” (Our World in Data, 2022)
4“The average person in high-income countries emits more than 30 times as much as those in low-income countries.” (Ritchie, 2023)
5“First, carbon emissions are higher per person in high-income countries, while low-income countries emit hardly any carbon at all. Some efforts to mitigate carbon emissions are most cost-effective when emission levels are high. For example, a US office building is typically kept at a lower temperature in summer than a comparable building in a poorer country. Insulating the US building has more payoff in reduced energy use, because the cooling use is more intense. The same reasoning applies more broadly to legal and regulatory change; for example, the reduction in carbon emissions that results from passing regulation to limit emissions from cars will be higher in countries with higher car ownership, all else equal.” (Glennerster & Jayachandran, 2023)
6“For example, to keep within 2 degrees of warming, high, upper-middle, lower-middle, and low-income countries will need emissions reductions of 39 percent, 30 percent, 8 percent and 8 percent, respectively, by 2030. To stay below 1.5 degrees of warming would entail more drastic emissions cuts of 60 percent and 51 percent for high- and upper-middle income countries.” (Black et al., 2023)
7“Emerging markets and developing economies (henceforth “EMDEs” in this chapter), even when excluding China, will account for the majority of the world’s annual greenhouse gas (GHG) emissions by 2040.” (Bhattarcharya et al., 2023)
8“According to the data from the World Bank, the highest growth in CO2 emissions based on income groups was observed among middle-income countries, where carbon emissions have increased by more than 130% over the period 1960–2016, compared to 40% in high-income countries.” (Majewski et al., 2022); “Electricity consumption in emerging markets and developing countries is projected to grow at around three times the rate of developed countries (IEA 2022).” (Hartwich & Farnleitner, 2024)
9“Chart: Share of global CO₂ emissions” (Our World in Data, 2023)
10“The CO2 emissions normalized for populations in middle-income countries for the years 2000–2016 are plotted in Figure 1. Evidently, there is a rising trend of carbon emissions, which seems to follow economic growth trends, demographic changes and other socio-economic processes that were taking place in this group of nations.” (Majewski et al., 2022)
11Emission increase in MICs: “However, a rapidly rising share of global emissions going forward will come from middle-income countries, and thus, policymakers in high-income countries argue that these countries should also bear some cost of and responsibility for action on their part.” (Glennerster & Jayachandran, 2023); Link between GDP and GHG emissions: “In recent years, several researchers have discovered a link between GDP and greenhouse gas emissions” (Furkan et al., 2023); “In Figure 1, we use data from the 2018 World Development Indicators to document a strong correlation between a nation’s carbon emissions per-person and its average income per-person.” (Prasad, 2024)
12“Rising incomes in middle-income countries will lead to a surge in demand for consumer durables, leading to rapid increases in the demand for electricity and energy.” (Kahn & Lall, 2023)
13“A doubling of personal real income increases the probability of owning a vehicle by 9.6 percentage points (Kahn and Lall 2022). We find similar magnitude income effects for air conditioners and refrigerators, washing machines, cell phones, computers, and televisions.” (Prasad, 2024)
14“As incomes rise, households will become increasingly mobile, and car ownership will begin to rise steeply. All this is to be expected as part of the development process. However, unless transport systems are increasingly decarbonized, the growth in transport-related emissions from developing countries can be expected to be steep.” (Ngulube & Foster, 2022)
15“In particular, many mitigation investment opportunities require substantial inputs of land and unskilled labor, which can make the same type of mitigation activity less expensive in low- and middle-income countries than in high-income countries.” (Glennerster & Jayachandran, 2023)
16“One reason for the mitigation bargains in low- and middle-income countries is that some cheap opportunities that are already being pursued in high-income countries remain untapped in low- and middle-income countries.” (Glennerster & Jayachandran, 2023)
17Environmental regulations and economic growth: “Environmental regulations may reduce immediate economic performance by imposing additional costs and risks” (Cabelkova et al., 2023); Impact on cost, innovation, risk, productivity or profit: “TABLE 1. The effect of environmental regulations on economic performance—two opposing views.” (Cabelkova et al., 2023); “Governments and citizens in low- and middle-income countries will, understandably, prioritize spending on basic needs and promoting economic growth, which could raise their relatively low standard of living, over contributing to the global public good of protecting the planet’s health.” (Glennerster & Jayachandran, 2023)
18“According to the World Bank’s classification of countries based on their Gross National Income (GNI) for the 2025 fiscal year, there are 26 Low-Income Countries, 51 Lower-Middle-Income Countries, 54 Upper-Middle-Income Countries and 86 High-Income Countries.” World Bank Group (accessed July 2025)
19“Annual CO₂ emissions: Carbon dioxide (CO₂) emissions from fossil fuels and industry. Land-use change is not included.” Our World in Data (accessed October 2025); “CO₂ emissions per capita: Carbon dioxide (CO₂) emissions from burning fossil fuels and industrial processes. This includes emissions from transport, electricity generation, and heating, but not land-use change.” Our World in Data (accessed October 2025); “Country ratings,” World Data Lab (accessed October 2025)
20World Data Lab provides 2050 projections for three scenarios (see appendix). We opted to use the BAU scenario given our belief that countries’ current level of ambition as indicated in their Nationally Determined Contributions provides a weak signal of future emissions, and that philanthropic support may remain key to reaching countries’ climate goals.
21Global Philanthropy Environment Index, 2025
22To provide an example, Climate Policy Initiative provides estimates of both bottom-up country-level climate funding needs and regional (and sometimes country-level) climate funding, sometimes alongside top-down country-level estimates of funding need. In the case of South Africa, this leads to 2023 top-down estimates of overall climate funding and funding need of $7.5B and $30.8B (respectively), while CPI’s more recent bottom-up funding need estimates indicate that South Africa will need $7.1B for mitigation only (and $22.8B for climate mitigation and adaptation). Using the top-down estimate of annual climate funding and the bottom-up estimate of funding need would suggest that South Africa has exhausted its funding need. In many cases, CPI does not provide country-level estimates at all, in which case we performed bespoke searches.
23For instance, the climate finance source we identified for Indonesia provides average annual figures from public and private financial institutions from 2015-2021, so the numbers for Indonesia are somewhat outdated. We are therefore less certain that the funding need meets the <50% criterion.
24“Global Landscape of Climate Finance 2025,” Climate Policy Initiative, 2025 (see discussion of CPI data in the appendix); Figure 3, "Known foundation support to regions, sectors, and strategies, 2019 to 2023, USD millions" (p. 9), ClimateWorks, 2025
25Note that all remaining countries that have been assessed by the Climate Action Tracker (CAT) are rated as “insufficient,” “highly insufficient,” or “critically insufficient” with respect to their policies, targets, and actions toward meeting the 1.5C global goal, indicating that all will need support. CAT has not assessed Malaysia.
26Giving Green, Country Prioritization 2025
27“Bottom-up climate finance needs: The climate finance required by countries to reach their national climate targets, as stated in official documents such as Nationally Determined Contributions (NDCs). These needs include both the finance required to be raised domestically and the financial support required from international (public and private) sources. While some countries estimate their climate finance needs using predictive models aligned to a 1.5°C pathway, in most cases, bottom-up needs are derived from a list of costed mitigation and adaptation measures or projects countries aim to implement.” CPI bottom-up climate finance needs data (accessed July 2025)
28“While there is not yet a globally accepted official definition of “climate finance needs”, CPI distinguishes between two types of needs…” CPI bottom-up climate finance needs data (accessed July 2025)
29“The green energy transition aims to replace high-carbon fossil fuels with low-carbon clean energy. Clean energy mainly consists of low-carbon renewable energy sources, such as solar, wind, hydro, bioenergy, geothermal, etc.” (Tian et al., 2021)
30“CO2 emissions by sector, India, 2021” (International Energy Agency, n.d.)
31“CO2 emissions by sector, India, 2021” (International Energy Agency, n.d.)
32“The Government of India has articulated and put across the concerns of developing countries at the 26th session of the Conference of the Parties (COP26) to the United Nations Framework Convention on Climate Change (UNFCCC) held in Glasgow, United Kingdom. Further, India presented the following five nectar elements (Panchamrit) of India’s climate action: 1. Reach 500GWNon-fossil energy capacity by 2030.; 2. 50 per cent of its energy requirements from renewable energy by 2030.; 3. Reduction of total projected carbon emissions by one billion tons from now to 2030.; 4. Reduction of the carbon intensity of the economy by 45 per cent by 2030, over 2005 levels.; 5. Achieving the target of net zero emissions by 2070.” (Ministry of the Environment, Forest and Climate Change, 2022)
33“From 2010 to 2015, China issued the highest number of climate policies. But from 2015 to 2022, India took the lead by issuing more than fifty climate change policies. These ranged from production-linked incentive schemes to policies that encourage the use of clean energy products such as rooftop solar energy.” (Sharma, 2024)
34 “India stands 4th globally in Renewable Energy Installed Capacity (including Large Hydro), 4th in Wind Power capacity & 5th in Solar Power capacity (as per REN21 Renewables 2024 Global Status Report).” (Invest India, 2024)
35“To be sure, the central government has taken key policy decisions that can accelerate the electricity transition. Investments in key transmission projects to evacuate renewable energy, new regulations that aim to improve clean energy integration in the electricity grid, and reforms in the electricity markets aim to support India’s ambitious non-fossil fuel-based capacity addition targets as part of its National Determined Contributions. Concurrently, the central government has implemented several energy efficiency initiatives aimed at various sectors, including appliances, buildings and industries.” (IEEFA, 2024)
36“The Indian government has implemented several policy measures to encourage renewable energy, including capacity targets, improvements to administrative processes and incentives for the domestic production of solar technologies, and ramping up the production of green hydrogen.” (Climate Action Tracker, 2023)
37“Both domestic coal production and coal imports have reached record highs in 2023.” (Climate Action Tracker, 2023)
38“While there is no plan for building additional coal capacity beyond what is under development until 2026-27, the latest electricity plan includes adding substantial new coal power capacity in the following five years, and the government is pushing for increased domestic coal production” (Climate Action Tracker, 2023)
39“The progress of states in the electricity transition is far more uneven. Some states have developed progressive steps, such as boosting decentralised renewable energy deployment, promoting solar pumps for agricultural needs, and enhancing storage solutions to ensure more renewable energy in their electricity systems.” (IEEFA, 2024)
40Evidence building is underfunded: “The energy sector, which receives the bulk of most funding across sectors, seemed most focused on implementation – that is funding moved towards deployment of solutions for end-beneficiaries (~39% for grassroot support) and testing out innovations in financing solutions, instead of evidence building.” (India Climate Collaborative, 2024); Most money flows to tangible social sector goals: “Although in recent years, domestic philanthropy has grown considerably to approximately $ 13 billion per annum, the funds flowing towards policy research do not attract much attention due to the lack of tangible short-term impacts. This is because domestic philanthropies have traditionally sought tangible social sector goals pertaining to activities in and around the community, workplace, and employees.” (Shakti Sustainable Energy Foundation, n.d.)
41Net zero by 2060: “Indonesia submitted its Long-Term Strategy for Low Carbon and Climate Resilience (LTS-LCCR) in July 2021, with a target of achieving net zero by 2060 or sooner, brought forward from its previously announced target year of 2070.” (Climate Transparency Report, 2022); International financial support: “At COP26, Indonesia signed a voluntary pledge on phasing out coal to be operationalised in two phases: retiring some coal power plants by 2031, with further plant retirements between 2036–2040. Final coal power plant retirement should take place between 2051–2060. International financial support is key to achieving these commitments.” (Climate Transparency Report, 2022)
42“Despite pledging to phase out coal, there is no clear roadmap and, conversely, the 2021–2030 National Electricity Plan maintains Indonesia’s reliance on coal power, while a ban on coal exports has been lifted.” (Climate Transparency Report, 2022)
43“While they play a substantial role in proliferating off-grid renewables in remote areas and increasing community participation, only a few research contributions looked at the specific influence of NGOs/CSOs on the Indonesia's national energy transition.” (Sekaringtias et al., 2023)
44“The JETP Secretariat routinely organizes outreach and consultation activities with key stakeholder groups, notably civil society and trade unions.“ (UNDP, n.d.)
45India: “To be sure, the central government has taken key policy decisions that can accelerate the electricity transition.” (IEEFA, 2024); India: “Major steps taken by the Government to accelerate the Indian economy’s transition to one powered by green energy include: (...) Permitting Foreign Direct Investment (FDI) up to 100 percent under the automatic route for renewable energy projects; Waiver of Inter State Transmission System (ISTS) charges for inter-state sale of solar and wind power for projects to be commissioned by 30th June 2025; Launch of Schemes such as Pradhan Mantri Kisan Urja Suraksha evam Utthaan Mahabhiyan (PM-KUSUM), Solar Rooftop Phase II, 12000 MW CPSU Scheme Phase II, etc.; Laying of new transmission lines and creating new substation capacity under the Green Energy Corridor Scheme for evacuation of renewable power” (PIB, 2023); Indonesia: “Analysis of the Net Zero Emission Roadmap (NZE) suggests that Indonesia’s net zero target can be achieved through the application of renewable energy (by sustainable resources), energy efficiency, electrification, and grid interconnection. Energy efficiency and electrification are top priorities to reduce emissions.” (AEER, n.d.); Indonesia: “The results of the study will be integrated in to the 2024 Update of the Comprehensive Investment and Policy Plan (CIPP), due to be completed by the end of the year. The JETP Secretariat published the first CIPP in November 2023, which outlines energy transition strategy and investment for the on grid power sector. This year, the CIPP Update will expand the scope to include off-grid power sector investments, as well as energy efficiency and electrification.” (JETP Secretariat, 2024)
How Can Nonprofits Support an Ambitious Clean Energy Agenda in India and Indonesia?
Nonprofit Sub-Strategies
From our preliminary understanding of the electricity ecosystem in India and Indonesia, we found that nonprofit organizations often focus on one or more of the following sub-strategies:
- Research and knowledge creation such as conducting modeling studies, techno-economic analyses, and policy briefs, as well as collecting, analyzing, and visualizing data to inform policy-making.
- Government and policy engagement towards an ambitious clean energy transition through engaging in government consultations, acting as advisory bodies, providing technical assistance, and collaborating with governmental agencies, for example on market incentives.
- Mobilizing finance and derisking clean energy projects such as engaging major investors in low-carbon investments and providing capital and technical support to increase the number of bankable climate projects.
- Implementing projects furthering a clean energy transition by understanding and addressing current gaps in the electricity sector. Implementation can incorporate installing renewable energy technologies, integrating smart grid solutions, deploying battery storage, or energy-efficient appliances.
- Community-level capacity-building and awareness-raising to build up community-level awareness around electricity access and the use of renewable energy sources, and to catalyze the uptake of energy-efficient products.
- Grassroots initiatives are community-based initiatives consisting of activists and organizations advancing bottom-up solutions to sustainable development, for example through demonstrations or media campaigns. They aim to build up public support and pressure for legislative changes that promote renewable energy adoption and sustainable electricity practices.
We evaluated the above pathways based on our understanding of their scale and feasibility (Table 2). For more information on these metrics and our research process, see Giving Green’s Research Process. Based on our assessment, we think research and knowledge creation alongside government and policy engagement could be especially promising. We think that think tanks that have long-established partnerships with the government have a large scope to influence national and sub-national electricity transition agendas and implementation plans by conducting reliable research and acting as advisory bodies.
We deprioritized conducting a funding need analysis of these sub-strategies due to the limited information available on philanthropic funding in India and Indonesia, as well as bandwidth constraints.
Scale and Feasibility Assessment of Various Nonprofit Approaches to the Clean Energy Transition in India and Indonesia
- Research and knowledge creation
- Scale: High. We believe that prioritizing and addressing research gaps is an important lever to driving an ambitious clean energy transition. Conducting literature reviews, collecting data, modeling, analysis, and data visualization lays the groundwork for informed decision-making and strategic planning across various sectors, e.g. in creating state and national climate action plans and setting targets.
- Feasibility: High. We think identifying and addressing knowledge gaps is highly feasible due to the strong presence of academic institutions, think tanks, and research organizations. These entities possess the expertise and partnerships necessary to conduct comprehensive studies. Additionally, international organizations have a significant interest in researching energy policies in India and Indonesia, which could boost both demand and funding for this type of work. We are confident that a well-curated research roadmap can be effectively pursued.
- Government and policy engagement
- Scale: High. Engaging with policies and the government, both at the national and state level, has a high potential for scale. National policies can drive large-scale change by setting regulatory standards, offering market incentives, supporting research and development, and creating a favorable environment for investments in renewable energy. We believe these policies could have a far-reaching impact, influencing both national and state-level energy priorities and budgets. State-level policies can bridge the gap between state and national aspirations, advancing alignment on an ambitious energy transition.
- Feasibility: Medium. We believe there is medium feasibility for effective government and policy engagement due to the political landscape in both India and Indonesia. The political environment, dispersed political power across various government bodies, bureaucratic inertia, and vested interests can all pose challenges. Organizations which have long-standing relations with the government may play significant advisory roles.
- Mobilizing finance and derisking clean energy projects
- Scale: High. We think policy- and international-coordination-based efforts to mobilize public and private finance for clean energy projects through loans and grants could reach a high scale because they could have high leverage in unlocking necessary funds. There is wide scope for mobilizing financing given that annual clean energy investment in LMICs was around $150 billion in 2020 and will need to reach over $1 trillion per year by the end of the 2020s to reach net-zero emissions by 2050.46 We think providing key stakeholders with capital and technical support could relieve capacity constraints and increase the likelihood of success.
- Feasibility: Medium. We think that increased funding for clean energy projects will increase the likelihood that they will be implemented. However, there have been persistent challenges in mobilizing finance for clean energy projects in LMICs, such as economic strains from the COVID-19 pandemic.47 The difference in profit between projects in HICs versus LMICs may also be too great for investors to consider taking on risks in LMICs.48 Additionally, even if clean energy projects were able to receive support through loans and grants, additional issues may remain, such as fossil fuel subsidies and restrictions on how foreign money can be invested.49 Based on early results from JETPs, we think efforts that mobilize finance may be more likely to succeed when deep technical work and work on building a social support to operate is done in-country before political “deals” are announced.50
- Implementing projects furthering a clean energy transition
- Scale: Low. We assessed the implementation of the clean energy transition projects as low scale because we think implementation of individual projects has a localized impact. Scaling up is a slow process and dependent on multiple factors, including funding, regional variation, stakeholder coordination, and the regulatory landscape. However, it is worth noting that numerous large-scale programs were initially implemented on a small scale, and only eventually, were embedded in national policies.
- Feasibility: High. We perceive the feasibility of implementing clean energy transition projects to be high. Implementation can be facilitated by institutional experience and strong partnerships with communities, governments, and private actors. Additionally, advancements in technology and decreasing costs of renewable energy sources can further enhance feasibility.
- Community-level capacity-building and awareness-raising
- Scale: Low. We believe that community-level capacity building and awareness raising have a low potential for scale. These activities are often tailored to specific circumstances and are carried out at the community or village level. Educational materials can reach a higher scale via social media dissemination. While we consider capacity building and awareness raising as crucial for creating strong public support and understanding, their impact tends to be localized.
- Feasibility: High. Capacity building and education are highly feasible to implement. They require relatively low financial investment and face few institutional barriers. The feasibility is further enhanced by the presence of local organizations and community leaders who can effectively engage with the communities. Additionally, communities, especially those with unreliable or unmet electricity demands, may show a strong interest in learning about and adopting renewable energy technologies. However, we do note that awareness and knowledge dissemination might not necessarily translate to effective adoption as there may be limited access to finance and the supply chain and less trust in nonprofits’ services (as opposed to public goods).
- Grassroots initiatives
- Scale: Medium. We assess the scale of grassroots initiatives in India and Indonesia as medium. Grassroots initiatives can create local impact, but scaling them to a national level may be challenging. The effectiveness of the initiatives may be limited by resource constraints, institutional barriers, organizational capacity, and the extensive geographical reach needed to generate national-level movements. In cases where grassroots initiatives have been successfully scaled up, we are still uncertain of the extent to which they have influenced policymaking.
- Feasibility: Low. We found a significant gap in the grassroots initiative space, particularly a lack of nonprofits working through citizen action such as protests or media campaigns. We note the feasibility of grassroots initiatives as low, primarily due to regulations and political barriers. Regulatory context may dissuade organizations from working on grassroots initiatives.
Clean Energy Transition in India and Indonesia: Theory of Change
Based on the scale and feasibility assessment, we think (1) research and knowledge creation, (2) government and policy engagement, and (3) mobilizing finance could be especially promising. We developed a theory of change to further explore how these sub-strategies would lead to a reduction in GHG emissions (Figure 4), followed by an examination of the assumptions behind our theory of change. We would like to emphasize that this is Giving Green's theory of change; we do not claim that this represents the theory of change of the nonprofit organizations we have assessed.
In our theory of change, we think government and policy engagement promoting a clean energy transition, generating research and knowledge and mobilizing finance can increase political support and capacity to implement an ambitious clean energy transition. Increased political support can lead to additional funding directed toward energy transition initiatives, passing of clean energy policies and greater alignment between state and national governments. Subsequently, program implementation can lead to improved efficiency and cost reduction through “learning by doing,” where operational experience can lead to efficiencies and reduced costs. Increased adoption of renewable energy would ultimately lead to a reduction in GHG emissions.

Examining the Assumptions Behind the Theory of Change
Below, we discuss and evaluate key assumptions related to our theory of change. For each of the assumptions, we rank whether we have low, medium, or high certainty about the assumption. Our assessment is based on both primary and secondary evidence, as well as our general impression of the plausibility of the assumption.51 Importantly, a number of the stages of the theory of change may not be amenable to easy measurement or quantification, are not supported by a robust evidence base, or are expected to occur in the future but have not occurred as of yet.
- Research and knowledge creation will increase political support and capacity to implement ambitious clean energy policies [medium certainty]
We have medium certainty that knowledge creation through academic and scientific research will enhance the political support and capacity for ambitious energy policies. On the one hand, credible data can inform policymakers about blind spots in the current agenda for reaching emission targets, highlight promising technological innovations and their consequential effects, manage investor risks, and showcase the cost-effectiveness of decarbonization pathways. Political leaders may use research to identify co-benefits and use findings around potential positive implications of climate policies as electoral currency. We think modeling studies that assess how net-zero transition pathways influence biodiversity, air pollution, employment, or energy access can underpin national development and decarbonization plans and make proposed pathways more politically salient. We think that research coupling climate goals with economic or developmental benefits could make the clean energy transition more feasible by addressing multiple political priorities.
However, this assumption may not always hold true as policymakers may be influenced by political incentives, electoral cycles, or vested interests, especially from fossil fuel industries.52 Short-term economic growth priorities or developmental outcomes may not support an ambitious clean energy transition. For example, an argument has been made that India should prioritize "energy availability for growth," given that India accounts for 17% of the global population but only 4% of global carbon dioxide emissions.53 Further, governments may be curtailed by bureaucratic transfers and organizational restructuring.54 Additionally, we think the engagement and outreach strategies of research organizations may influence the level of political support they receive.
- Government and policy engagement will lead to increased political support and implementation of clean energy projects [medium certainty]
We believe that government and policy engagement around a more ambitious clean energy transition may increase the likelihood of higher political support or implementation but does not guarantee it. Think tanks’ engagement with governmental bodies may influence the level of political support: for example, the Director General of India’s Bureau of Energy Efficiency (BEE) recognized the role of public partners as “pivotal” in advancing initiatives of the BEE.55 Institutions may have different ways of collaborating with the government, yielding varying results.
- Increased political support will lead to increased alignment between central and state governments [medium certainty]
We have medium certainty that increased political support will lead to closer alignment between central and state governments on an ambitious clean energy transition. We think that political support alone may be insufficient as legislative action may be curtailed by distinct priorities. In India, coordination between different ministries (intra-ministerial) and between central and state-level governments (intra-governmental) has been identified as a key area for improvement.56 For example, the Indian Minister of Finance, in the 2024 Budget Speech, emphasized the need to “build consensus with state governments” for a new wave of reforms.57 Similarly, in Indonesia, power fragmentation can be noted in the diverging announcements regarding Indonesia’s net-zero target dates, ranging between 2045 to 2070, depending on the government body.58 Such power segmentation can lead to contradictory regulations and decreased confidence and investments in the renewable energy market.59
- Enhanced political support will increase the funding that flows to clean energy transition projects [medium certainty]
We cannot state with certainty that political support translates to regulatory and policy certainty, and subsequently to increased private and public funding for clean energy transition projects. Even with political will, national fiscal constraints could persist as both India and Indonesia have competing spending priorities. For instance, on the one hand, India’s Union Budget 2024-2025 identified energy security as a top priority and aims to further it via, among other efforts, increased subsidies to rooftop solar installations, R&D funding for small modular nuclear reactors, promoting pumped storage projects, efficient thermal power plants, a roadmap for ‘hard-to-abate’ industries, and financial support for an electricity transition for small industries.60 On the other hand, current green finance represents less than 25% of the total requirement ($2.5 trillion) for India to achieve its Nationally Determined Contributions (NDCs) by 2030.61 Similarly, the Indonesian government allocates approximately $5.7 billion annually to climate change mitigation, around 30% of the required funding to meet the NDC targets.62
- Implementation of clean energy transition projects will lead to higher adoption of renewable energy technologies [high certainty]
We believe that increased implementation of clean energy transition projects, which includes planning, construction, and operationalization of renewable energy infrastructure, would lead to higher uptake of renewable energy technologies. Widespread program implementation would lead to generating best practices and reducing operational costs, facilitating the transition to renewable energies.
One potential bottleneck to this transition could be the quality of implementation, which in India has been hampered by bureaucratic and administrative challenges across various government tiers.63 Similarly, Indonesia’s regional governments have faced challenges linked to technical expertise and capacity, hindering their adoption of renewable energies.64 Inconsistent implementation in Indonesia has also been identified as a roadblock, decreasing investor confidence and potentially leading to reduced financing.65
Additionally, ensuring social support for these projects would be crucial for their success, as it can prevent delays in the large-scale adoption of renewable energy systems. For instance, in Indonesia, research indicates that around 180,000 workers involved in planning and constructing new coal plants might lose their jobs by 2030, and over the next two decades, 150,000 employees who operate and maintain coal power plants could be affected.66 It is essential to ensure a just transition by creating dignified and green jobs to minimize the effect on communities dependent on traditional energy and foster broader societal support.
---
46“Clean energy investment in emerging and developing economies declined by 8% to less than USD 150 billion in 2020, with only a slight rebound expected in 2021. By the end of the 2020s, annual capital spending on clean energy in these economies needs to expand by more than seven times, to above USD 1 trillion, in order to put the world on track to reach net-zero emissions by 2050.” (IEA, n.d.)
47“Annual investments across all parts of the energy sector in developing and emerging markets have fallen by around 20% since 2016, in part because of some persistent challenges in mobilising finance for clean energy projects. The Covid-19 pandemic has weakened corporate balance sheets and consumers’ ability to pay, and put additional strains on public finances. The effects have been felt most severely in emerging and developing economies, and the impacts on public health and on economic activity are far from over, undercutting the prospects for a swift recovery and the means for a sustainable one.” (IEA, n.d.)
48“From the perspective of private investors, on a project-by-project basis, the levels of profit must be comparable to returns on investments that they make in the Global North. Why incur more project risk when there are less risky investment opportunities in the rich countries? The World Bank, and now the IPG and GFANZ, hope that concessional loans might make clean energy projects more “bankable,” but the evidence suggests that the gap between profit levels in the North and those in the South is frequently far too wide.” (Sweeney, 2024)
49“Project-specific factors are compounded in many cases by broader cross-cutting issues, which undermine risk-adjusted returns for investors and the availability of bankable projects. For projects, these include the availability of commercial arrangements that support predictable revenues for capital-intensive investments, the creditworthiness of counterparties and the availability of enabling infrastructure, among other challenges. Broader issues include subsidies that tilt the playing field against sustainable investments, lengthy procedures for licensing and land acquisition, restrictions on foreign direct investment, currency risks, and weaknesses in local banking and capital markets.” (IEA, n.d.)
50Social support to operate: “From the IPG side, there has been a sense the JETP implementation has been slower and the challenges more intractable than first anticipated in the first-mover markets. These include challenges around social license in JETP countries and barriers to enacting domestic regulatory reform to attract investment.” (Rockefeller Foundation & EDF, 2024); Technical work: “A final criticism is that the political “deal” or announcement has in the past preceded deep technical work, leading to unrealistic expectations and misunderstandings between partners.” (Rockefeller Foundation & EDF, 2024)
51We describe our certainty as low/medium/high to increase readability and avoid false precision. Since these terms can be interpreted differently, we use rough heuristics to define them as percentage likelihoods the assumption is, on average, correct. Low = 0-60%, medium = 70-80%, high = 80-100%.
52“Neglect of renewable energy relates to a variety of political and economic factors, including lobbying and the use of coal to satisfy increased energy demand [95].” (Sekaringtias et al., 2023)
53“The Minister said that the nation is not going to compromise on the availability of energy for our growth, adding that the country is responsible for only 4% of legacy carbon dioxide load in the environment, whereas our population is around 17% of world population. (...) Shri Singh said that the developed countries have reached their peak of development; so, their emissions will either remain static or come down. “However, the building stock of developing countries will multiply, since we are developing; we will need more cement, steel and aluminum to construct those buildings and plants. This will lead to more emissions. So, we need space to grow.” (PIB Delhi, n.d.)
54Bureaucratic transfers in India: “Unique microlevel data on Indian bureaucrats support our key predictions. Politicians use frequent reassignments (transfers) across posts of varying importance to control bureaucrats.” (Iyer & Mani, 2009); Corruption in Indonesia: “It argues that in addition to criminal action, corruption eradication efforts must also, and more importantly involve bureaucratic reform to ease public services and hold public officials accountable for their actions. Corruption has always been one of the major issues facing not only the Indonesian economy but also every branch of the Indonesian government.” (Yustia & Arifin, 2023); Bureaucratic reform in Indonesia: “Organizations are also often faced with re-structurisation which undermines the stability required in any long-term planning, making it difficult to complete programmes and focus efforts at the implementation level.” (Sekaringtias et al., 2023)
55“In his welcome address, DG, BEE, Shri Abhay Bakre said: "I appreciate the effort of our partners from the public and private sectors, as well as multilateral agencies. Their unwavering support and guidance are pivotal in advancing key BEE programs and initiatives, reflecting a shared commitment to a sustainable and energy-efficient future."” (PIB Delhi, 2024)
56Intra-ministerial and inter-governmental coordination: “Furthermore, intra-ministerial and inter-governmental (between central and state governments) coordination should be enhanced.” (OECD & IEA, 2012); Intra-ministerial split of responsibilities: “Energy policy in India is conducted by a number of different ministries that have responsibility for their sector.” (OECD & IEA, 2012)
57“To usher in the next generation of reforms, the Union government will need to build consensus with state governments (...) One, she mentioned that they want the next generation of reforms, and which would need consensus to be built up with states.” (Gupta, 2024)
58Power fragmentation: “While it is encouraging to see increasing exchanges and debates, the challenge of coordination between different organizations is a persisting barrier. This becomes apparent from the various announcements from different ministries on Indonesia's climate policy, carrying different net-zero targets ranging between 2045 and 2070 – before now it is unified to ‘2060 or sooner’.” (Sekaringtias et al., 2023); Lack of central and regional coordination: Inter-governmental alignments: “The national and regional plans as well as the long-term and mid-term plans are often disconnected with differences in the stipulated targets in the different documents.” (Sekaringtias et al., 2023)
59“Conflicting agencies and fragmented power can lead to more contradictory regulations, less confidence in the renewable market, and less investments in RE projects which then loop back to increased conflicting agencies and fragmented power.” (Sekaringtias et al., 2023)
60 “Priority 6: Energy Security. Energy Transition (...); PM Surya Ghar Muft Bijli Yojana (...); Pumped Storage Policy (...); Research and development of small and modular nuclear reactors (...); Advanced Ultra Super Critical Thermal Power Plants (...); Roadmap for ‘hard to abate’ industries (...); Support to traditional micro and small industries” (Agrawal, 2024)
61“Green finance flows must increase rapidly to ensure that India meets its Panchamrit targets. India needs approximately INR 162.5 lakh crores (USD 2.5 trillion) till 2030 for NDCs and INR 716 lakh crores (USD 10.1 trillion) to achieve Net-Zero emissions by 2070. By conservative estimates, the current tracked green finance in India represents less than 25% of the total requirement across sectors just to meet the NDCs.” (Khana et al., 2020)
62“The state budget allocated to climate change mitigation is ca. USD 5.7 billion per year, representing only about 30% of the financial needs to achieve the NDC targets.” (Global Green Growth Institute, 2022)
63“An increase in effective implementation of energy policies is required through the improvement of bureaucratic and administrative processes to assure a timely completion of energy projects. This will also contain unnecessary cost escalation of complex projects.” (OECD & IEA, 2012)
64“The low awareness and capabilities at the regional level often hinder the implementation of renewable energy.” (Sekaringtias et al., 2023)
65“Frequent changes to policy, regulatory delays and patchy implementation of government policy by PLN all play a role in further undermining investor confidence and increasing project development risk.” (IISD, 2018)
66“Over the coming decades, as coal use is phased-down in Indonesia, some of these workers will exit the sector naturally through retirement as well as regular turnover. However, even after accounting for these using data on the age profile of the current workforce, around 180,000 workers involved in planning and constructing new coal plants may still be forced to find alternative employment by 2030. The following two decades may see further job losses for around 150,000 workers who are both operating and maintaining coal plants, as well as upstream workers in the coal mining sector (focusing on the share of Indonesian coal mining that supplies domestic electricity production).” (Skribbe & Fearnehough, 2023)
What Are the Key Uncertainties and Open Questions?
What are the challenges and risks of categorizing countries as LMICs?
By grouping countries together, we risk generalizing them. LMICs’ contributions, interests, strategies, and climate actions vary significantly between one another and often even at subnational levels. While we aim to highlight the importance of rising emissions in LMICs, we acknowledge that the level of variation prevents meaningful generalization.67 We acknowledge the limitations of such framing and how it may often be employed to extend legacies of racism, imperialism, colonialism, and the “us versus them” perspective.68 For example, in the context of global emissions, we are cognizant that the LMICs versus HICs framing can be dangerous as it may deemphasize the importance of decarbonization among high-emitting LMICs in the context of historical emissions of HICs.69 As an organization, we aim to apply "targeted categorization" by discussing LMICs only when there are well-theorized and justified common conditions that apply to all these countries, thereby grouping them together.70
Is Giving Green well-placed to assess the energy ecosystem in India and Indonesia and to identify organizations driving ecosystem change?
Evaluating grants to LMICs is new to us as of this writing in 2024. We recognize that building such knowledge is not a one-time activity but a long-term process of understanding the complexities, dynamics, and nuances of the broader energy ecosystem. We remain aware that our present understanding may be characterized by blind spots and biases. For example, our process of identifying a long list of nonprofits was closely tied to speaking with a select few international funders who might reflect a Western approach to climate philanthropy in LMICs. This likely led us to overlook or underrate certain organizations. We think that the funding in LMICs may be neglected compared to HICs, but digging deeper into sector-based funding needs within these countries, the energy sector might not be especially neglected in comparison to other sectors.71
To what extent can nonprofit organizations influence change in India's and Indonesia’s clean energy transition?
We are uncertain about the extent of influence that nonprofit organizations have on the energy policy transition in India and Indonesia. On the one hand, we have seen nonprofits provide crucial inputs in the governance decision-making process, build dashboards used by the government, and co-develop and support the implementation of state-level climate action plans.72 On the other hand, we cannot state with certainty that the government would not have taken similar actions in the absence of these organizations. Hence, whether nonprofits drive a more ambitious clean energy transition relative to the counterfactual remains ambiguous.
To what extent can we justify our focus on the clean energy transition rather than climate adaptation in LMICs?
Giving Green’s theory of change is centered on reducing GHG emissions, subsequently leading to improved human and ecological wellbeing. We believe that adaptation is an important field; however, we decided to focus on mitigation strategies in part because that is where our team’s expertise lies. We acknowledge that this focus may further concentrate attention on climate change mitigation rather than adaptation in LMICs, which may not align with national priorities or funding needs. We recognize that LMICs place a stronger emphasis on adaptation, as opposed to the primary focus on mitigation in HICs.73 After all, LMICS are most vulnerable to the effects of climate change and may have lower capacity to adapt to climate change.74 We are cognizant that we may be perpetuating Western funders’ lens by prioritizing funding and research around a clean energy transition rather than disaster risk management or resilience building. We have not explored the intersection between adaptation and mitigation beyond some work we have done on clean cooling.
---
67“Without highlighting such differences, it makes little sense to use the term ‘Global South’. Its members are affected differently, and contribute differently to global climate change. They neither share a common view, nor do they pursue joint interests when it comes to international climate negotiations. Instead, they are organized into more than a dozen subgroups of the global climate regime. There is no single climate strategy for the Global South, and climate action will differ enormously from country to country. Furthermore, just and equitable transitions may be particularly challenging for some countries.” (Fuhr, 2019)
68“When the category is used in global scholarship without proper justification it can serve to extend legacies of racism, imperialism, colonialism and a general othering or ‘foreign gaze’.” (Lencucha & Neupane, 2022)
69“Given the adverse effects of climate change, particularly in the poorest countries of the Global South, this narrative entails a risky strategy; it protects the high-emission countries of the Global South from changing their developmental pattern and impacts on the welfare of its poorer members. In other words, arguing about historical responsibilities tends to occasionally ignore current trends and the need for swift transitions towards low-carbon development, in both the North and South, particularly in their high-emission countries.” (Fuhr, 2019)
70“To move beyond the unreflexive use of LMIC in global scholarship we suggest a more nuanced approach to categorisation, namely targeted categorisation. The notion of targeted categorisation permits the use of LMIC when justified and if phenomena being studied can be linked to well-theorised and strongly justified common conditions that exist in this income-based categorisation. We suspect that such an approach will both reduce the number of studies using this category, given that many studies do not have good reason to use it, while enhancing our understanding of phenomena.” (Lencucha & Neupane, 2022)
71LMIC funding has been neglected: “The United Nations Conference on Trade and Development (UNCTAD) today called for urgent support to developing countries to enable them to attract significantly more investment for their transition to clean energy. UNCTAD’s World Investment Report 2023 published today shows that much of the growth in international investment in renewable energy, which has nearly tripled since the adoption of the Paris Agreement in 2015, has been concentrated in developed countries.” (UNCTAD, 2023); LMIC funding has been neglected: “The report finds that while loans continued to represent “the lion’s share” of public climate finance, grants, which are being prioritized in lower-income countries, more than doubled, increasing by USD 13.4 billion between 2016 and 2022. Yet, climate finance to low-income countries was only 10% in 2022.” (IISD, n.d.); Energy sector might not be neglected in comparison to other sectors: “The energy sector, which receives the bulk of most funding across sectors, seemed most focused on implementation – that is funding moved towards deployment of solutions for end-beneficiaries (~39% for grassroot support) and testing out innovations in financing solutions, instead of evidence building.” (India Climate Collaborative, 2024)
72Solicit inputs: “The Bureau of Energy Efficiency is implementing measures to improve energy efficiency in cold storage facilities, micro-cold rooms, and packhouses. This initiative involves collaboration from various stakeholders: the government providing policy support, industries innovating affordable technology, civil society organisations conducting research and raising awareness, and funding organisations scaling up financing. The conference serves as a platform for these stakeholders to unite and identify opportunities for integrating energy efficiency into the national cold-chain infrastructure.” (Shakti Sustainable Energy Foundation, n.d.); Build dashboards: “The India Climate and Energy Dashboard (ICED) is NITI Aayog's flagship initiative developed in association with Vasudha Foundation.” (NITI Aayog, n.d.); Co-develop state climate action plans (UP): “CEEW signed an MoU with the Uttar Pradesh State Rural Livelihood Mission (UPSRLM) to support capacity building, market research, and draft strategies to deploy DRE-based livelihoods among rural communities across the state.” (CEEW, 2023); Co-develop state climate action plans (Mumbai): “Mumbai’s Climate Action Plan has been drafted by the Municipal Corporation of Greater Mumbai (MCGM) with technical support from WRI India, engaged as a knowledge partner.” (BMC, n.d.)
73“Vulnerable countries broadly emphasise impacts and adaptation (H1) In line with our hypothesis, more vulnerable countries tend to discuss IAV more extensively in their Executive Summaries, compared to less vulnerable nations who put more emphasis on mitigation.” (Wright et al., 2023)
74“The Least Developed Countries (LDCs) are a group of 49 of the world's poorest countries. They have contributed least to the emission of greenhouse gases (GHGs) but they are most vulnerable to the effects of climate change. This is due to their location in some of the most vulnerable regions of the world and their low capacities to adapt to these changes. Adaptation to climate change has become an important policy priority in the international negotiations on climate change in recent years.” (Huq et al., 2003)
What is the Bottom Line and What Are the Next Steps?
We think supporting research and knowledge creation, government and policy engagement, and mobilizing finance towards a clean energy transition are particularly promising areas in India and Indonesia. As India and Indonesia continue to develop economically, we believe these strategies could be key levers in their energy transition, leading to reduced GHG emissions. We think that nonprofit organizations promoting these strategies can play a central role in advancing more ambitious electricity policies and, we are therefore either currently funding or considering funding organizations working on these strategies.
Acknowledgements
This work has greatly benefited from the feedback provided by a variety of advisors, experts, and reviewers throughout the research process; Giving Green is grateful for those who shared their time, experience, and ideas. We would especially like to acknowledge the principal reviewer, Ashwini K Swain, for providing a deep review of this deep dive during its final stages of development. All opinions remain those of Giving Green alone, and any remaining errors are our own.
Appendix: Data Sources
Country prioritization: Scale
World Data Lab’s emissions scenario data
World Data Lab’s World Emissions Clock (WEC) uses methodologies published or under peer review in academic journals to flesh out three sectoral emissions pathways for 182 countries to 2050. The scenarios include emissions under (1) business as usual, (2) successful implementation of unconditional75 (supra)national promises made as part of United Nations climate negotiations (i.e. Nationally Determined Contributions), and (3) emissions that reflect a cost-effective path to meet the global 1.5°C target.
The business-as-usual projections derive from large time-series models using publicly available data to identify and account for trends and interdependencies between population, affluence (GDP), and technology (sectoral emissions intensity per unit GDP)—with supplemental drivers including demographics and urbanization—to project future sectoral GHG emissions intensities in 182 countries. See Figure 5 for a schematic overview. WEC developed the methodology behind its business-as-usual projections in close collaboration with Vienna University of Economics and Business, University of Oxford, and IIASA.

The International Institute for Applied Systems Analysis (IIASA) uses integrated assessment models to provide the GHG emissions scenarios for (2) and (3) (see NGFS Scenarios Portal for more information), and downscaling methods that account for variables such as countries’ development status and energy mix support country-level estimation. The cost-efficiency perspective in scenario (3) does not incorporate a fair share perspective – in accordance with “common but differentiated responsibilities” (CBDR)– based on countries’ development status or cumulative emissions, which is incorporated into Climate Action Tracker’s methods (see below).
Given variation in the ambition and credibility of achieving countries’ NDC commitments, the lack of accounting for CBDR in the WEC methodology, and our belief that countries with more ambitious and credible commitments should receive equal or more consideration in our grantmaking for both fairness and tractability reasons, we focus on expectations of countries’ emissions in 2050 under a business-as-usual scenario.
See the World Emissions Clock’s methodology for more information.
Climate Action Tracker Country Ratings
Climate Action Tracker (CAT) rates countries based on government targets, policies, and actions to reduce GHG emissions in line with the global 1.5°C target. More specifically, they rate whether countries’ policies and actions are aligned with least-cost mitigation pathways or fair share principles; whether their domestic or internationally supported targets are sufficiently ambitious vis a vis least-cost mitigation pathways; and the extent to which a country’s promises, actions, and (if relevant) financing of other countries’ mitigation efforts could be considered a fair and sufficient contribution. See Figure 6 for a schematic overview.

CAT applies a 5-point rating system from critically insufficient to 1.5°C Paris Agreement compatible to each country, where the former is indicative of minimal or no action and complete incompatibility with the Paris Agreement target, and the latter indicates that a country’s policies and promises are aligned with the target. Where available, they also evaluate net zero targets and land use, land-use change, and forestry emissions, the latter of which is excluded from the above rating assessment in large part due to data uncertainty, country comparability, and methodological constraints.78
CAT takes a balanced perspective of the importance of both cost efficiency and fairness in reaching global mitigation targets. CAT’s approach suggests that climate finance should bridge the gap between a country’s least-cost domestic emissions reductions and the additional reductions needed to meet its fair share, by financing cheaper emissions cuts abroad. To assess the sufficiency of climate finance, CAT reviews absolute contributions, trends, commitments, and overseas fossil fuel finance; their approach excludes adaptation financing.
Country Prioritization: Feasibility
Global Philanthropy Environment Index Scoring
The Global Philanthropy Environment Index is conducted every few years at the Indiana University Lilly Family School of Philanthropy. It is a tool developed to support philanthropists, civil society, and governments in understanding the role of philanthropy in solving critical global issues. The index rates 95 countries and economies on several dimensions, ultimately providing a comprehensive score that conveys the political, economic, and socio-cultural barriers and incentives for philanthropic funding.
Researchers partner with 173 country, regional, and global experts to produce the scores, starting with an expert questionnaire that solicits experts’ views and scoring on 11 indicators spanning six factors: cross-border philanthropic flows, tax incentives, ease of operating a philanthropic organization, and the political, economic, and sociocultural environments. The questionnaire is followed by several rounds of review (e.g., to compare against desk research internally, and to undergo scrutiny by regional experts, and gather collective in-person feedback), and finally approved by countries that are assessed.79
Country prioritization: Funding Need
ClimateWorks Data
As of 2025, ClimateWorks has produced five annual reports detailing regional philanthropic funding for climate change mitigation. Through partnerships and desk research, they collate “funding data from [over 90] foundations with major climate programs, publicly available data on official development assistance flows, and data on donations from individuals to climate-relevant causes.”80
Climate Policy Initiative Data
Global Landscape of Climate Finance 2025
Climate Policy Initiative provides data on climate finance across regions,81 where China is the only country that is sufficiently large to be categorized as a recipient. The data suggests that there was $281 billion in climate finance directed to emerging markets and developing economies and $19 billion to least developed countries for mitigation in 2023.
The methodology includes a comprehensive set of actors and financing instruments, and distinguishes between finance for mitigation, adaptation, and dual-purpose financing. Data are aggregated from several sources, such as the International Energy Agency, the World Bank, and Bloomberg New Energy Finance.82

Bottom-Up Climate Finance Needs
CPI also provides a “bottom-up” climate finance needs dataset that includes countries’ own estimates of the financing required to meet their Nationally Determined Contributions. Collectively, emissions reductions outlined in countries’ NDCs do not represent sufficient mitigation to reach the global target of 1.5°C warming. As such, bottom-up estimates should be considered a lower bound of true climate finance needs, and countries’ NDCs will vary in their ambition. Still, the estimates are the closest we could find to a semi-comprehensive set of estimates of country-level climate finance needs.

---
75“Domestic targets are emissions reductions they want to achieve with own means on their own territory, often referred to as ‘unconditional targets’. Internationally supported targets are for emissions reductions through support from other governments, and often referred to as ‘conditional targets’.” Climate Action Tracker (accessed September 2025)
76World Data Lab (accessed September 2025)
77Climate Action Tracker (accessed October 2025)
78“The reasons for focusing on emissions excl. LULUCF are, in summary: The importance of decreasing CO2 and other GHG emissions from fossil fuel combustion, industry, agriculture and waste sources in order to limit warming to 1.5°C. Large data uncertainty around LULUCF emissions data. The need to compare ‘like with like’ between NDCs, and to disentangle diverse approaches to LULUCF accounting in order to understand trends in decarbonisation. The need to increase transparency about the adequacy of targets. Methodological constraints with fair share literature predominantly based on GHG emissions excluding LULUCF and with very different drivers and dynamics between fossil fuel and industrial GHG emissions and LULUCF.” Climate Action Tracker (accessed September 2025)
79“To achieve these objectives, the Indiana University Lilly Family School of Philanthropy (hereafter “School”) partnered with 173 country, regional, and global experts to produce the 2025 GPEI over the course of one year. Production involved six key steps. Between February and September 2024, country experts complete a standard questionnaire containing 11 indicator questions to evaluate the environment on the basis of six factors. For each question, country experts assign a numeric score (using a 1-5 scale) and provide a narrative explanation to justify each score.” Global Philanthropy Environment Index (accessed September 2025)
80ClimateWorks, 2025 (p. 22)
81“Global Landscape of Climate Finance 2025,” Climate Policy Initiative, 2025
82“Historical key data and methodological improvements,” Climate Policy Initiative, 2025 (p. 3)
83Climate Policy Initiative, 2025, “Figure 1: Global Landscape of Climate Finance tracking framework overview” (p. 7) and “Table 5: Data sources” (p. 27)
84Climate Policy Initiative, 2024, “Table 1: Overview of top-down and bottom-up climate finance needs” (p. 2)
Support Our Work
Giving Green Fund
One fund. Global impact. One hundred percent of your gift supports a portfolio of high-impact climate organizations, vetted by our research.
Best for:
Donors who want the simplest way to impact multiple climate solutions.
Top Climate Nonprofits
Meet the organizations on Giving Green’s list of high-impact nonprofits working to decarbonize our future, identified through our rigorous research.
Best for:
Donors who want to give directly and independently.
Support Our Work
We thoroughly research climate initiatives so you can give with confidence. For every $1 we receive, our work unlocks another $21 for effective climate solutions.
Best for:
Donors who want to amplify their impact through research.
.png)
.png)

.png)
.png)


.png)
.png)
.png)
.png)
.png)
.png)
.png)
.png)


.png)
.png)


.png)


.png)

.png)

.png)

.png)
.png)


.jpg)


.png)
.png)

.png)


.png)
.png)

.png)

.png)
.png)

.png)

.png)


.png)
.png)


.jpg)

.png)
.png)


.png)
